
Solana’s price is showing renewed downside risk after bearish engulfing candles rejected key resistance, with weakening market structure increasing the likelihood of testing sub-$80 support levels.
Summary
- Bearish engulfing candles confirm rejection at the key $90 resistance
- Loss of the point of control signals weakness, favoring further downside
- $78–$80 support is the critical zone, with Fibonacci and liquidity confluence
Solana (SOL) price action has shifted back into a vulnerable technical position after a failed attempt to reclaim higher resistance. What initially looked like a potential stabilization has now turned into renewed weakness, as sellers regain control after a rejection at a key resistance zone. The broader structure remains corrective, and recent candlestick behavior suggests that downside continuation is becoming increasingly likely.
As price trades back below important value levels, attention is now turning to high-timeframe support zones that could come into play in the near term. Whether these levels hold or fail will determine if Solana can stage a meaningful bounce or if the correction deepens further.
Solana price key technical points
- Bearish engulfing candles rejected $90 resistance, reinforcing seller control
- Loss of the point of control signals weakness, favoring rotation lower
- $78–$80 support zone aligns with Fibonacci confluence, acting as a key downside target
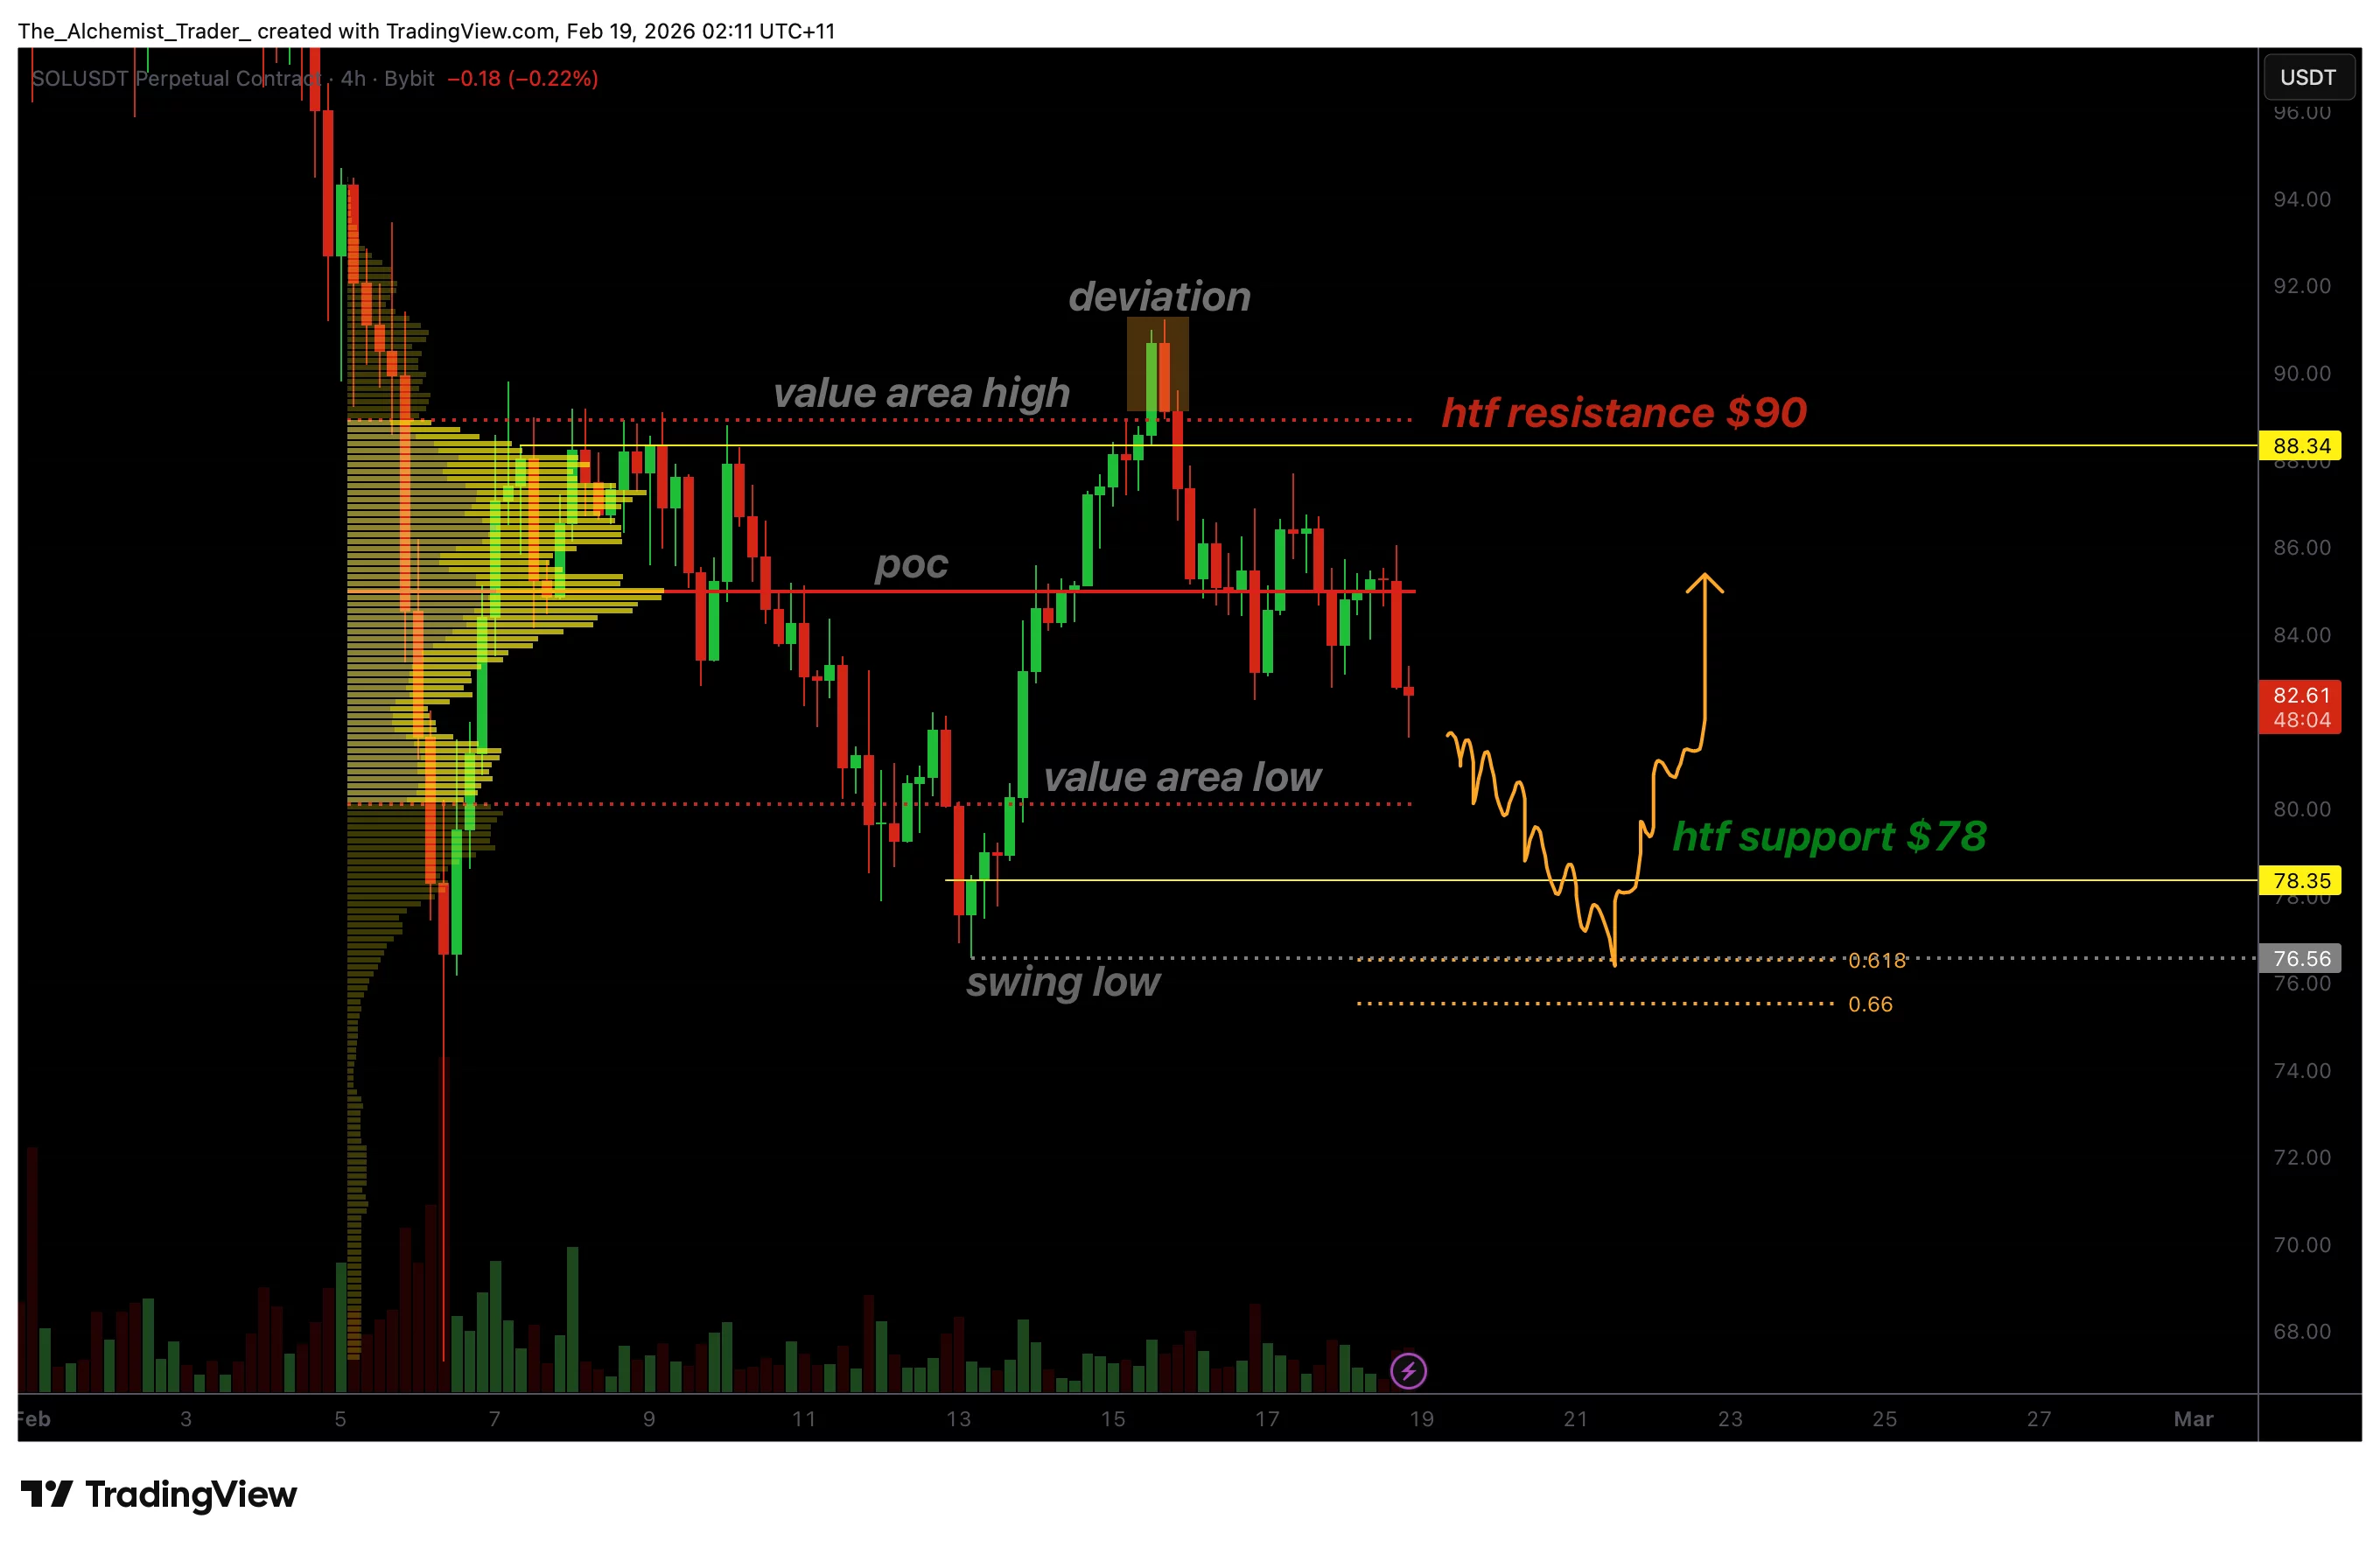
Solana recently attempted to push above the $90 resistance level, but the move failed to gain traction. Price quickly closed back below resistance, forming bearish engulfing candles that invalidated the breakout attempt. These engulfing structures are significant because they often reflect aggressive selling pressure entering the market when buyers lose control.
The rejection from resistance is further reinforced by Solana’s inability to hold above the point of control (POC). Multiple counter-trend closes below this level indicate that the market has shifted away from balance and back into bearish momentum. When price loses the POC after a failed breakout, it often signals the start of a deeper corrective rotation.
Loss of value opens path toward $78 support
With price now trading below the point of control, the next logical downside magnet is the value area low. This level defines the lower boundary of fair value within the current range and frequently acts as a target during corrective phases.
Below the value area low sits high-timeframe support around $78, which also marks the lower edge of the broader trading structure. A move into this region would place Solana below the $80 psychological level, increasing volatility as traders reassess risk.
From a technical perspective, the $78 area carries additional significance due to its alignment with the 0.618 Fibonacci retracement. Fibonacci confluence often attracts price during corrective moves, particularly when paired with visible resting liquidity.
Liquidity sweep or deeper breakdown?
The swing low near $78 indicates an area with likely resting liquidity. Markets often dip into such zones to trigger stop-loss orders before deciding on the next directional move. If Solana quickly trades into this region and then reclaims it with strong buying interest, the move could resemble a liquidity sweep, setting the stage for a reactive bounce.
However, timing and structure will be critical. A slow grind lower, or prolonged acceptance below $78, would weaken the bounce thesis and suggest that a deeper corrective phase is unfolding. In that scenario, the market would be signaling that buyers are not yet ready to defend key support.
Broader market structure remains corrective
From a market structure standpoint, Solana has not yet invalidated its bearish bias. Lower highs remain intact, and recent attempts to reclaim resistance have failed. Without a decisive reclaim of value and strong bullish volume, rallies should continue to be treated as corrective rather than trend-changing.
The presence of bearish engulfing candles at resistance adds further weight to this view, as such patterns often precede continuation lower rather than immediate reversal.
What to expect in the coming price action
From a technical, price-action, and market-structure perspective, Solana is likely to continue rotating lower in the short term. As long as the price remains below the resistance and the point of control, the probability favors a move toward the value area, low and high-timeframe support near $78.
Traders should closely monitor price behavior around this zone. A sharp reaction and reclaim could trigger a short-term relief bounce, while sustained trading below $80 would increase the risk of a deeper correction.
Until bullish acceptance returns above key value levels, downside risks remain elevated, and Solana’s next meaningful move is likely to be defined by how the price reacts at sub-$80 support.