
Tom Lee’s Bitmine has moved closer to its goal of acquiring 5% of the total supply with its latest 20K ETH purchase. But a bearish flag pattern confirmed on the weekly ETH/USDT chart suggests a potential price correction for Ethereum may be imminent.
Summary
- Tom Lee’s Bitmine has acquired 20,000 ETH for $41.98 million.
- Market demand generated from spot Ethereum ETFs remains weak.
- A bearish head and shoulders pattern was confirmed on the weekly chart.
Bitmine, the tech-focused infrastructure company run by renowned market strategist Tom Lee, had acquired another 20,000 ETH worth $41.98 million over the weekend. The move follows its acquisition of over 40,000 ETH in late January, valued at approximately $117 million at that time.
Following Bitmine’s latest purchase, the company’s total reserves now stand at nearly 4.29 million ETH, making it nearly 71% complete with its goal of owning at least 5% of the total circulating supply.
In contrast to the debt-fueled acquisition strategy popularized by Michael Saylor’s Strategy, Bitmine Immersion Technologies (BMNR) maintains a pristine, zero-debt balance sheet bolstered by over $586 million in cash and short-term liquidity.
The company’s most strategic pivot, however, is the transition to active Ethereum staking. By putting its massive ETH treasury to work, Bitmine is positioned to generate over $500 million in annual high-margin revenue, provided staking yields hold above the 2.5% threshold.
When large institutional players like Bitmine continue to gobble up supply, it typically tends to create a supply shock, which helps support price floors in the long run.
However, the overall outlook for Ethereum still remains precarious as a number of bearish catalysts may continue to overshadow any optimism generated by big buys.
First, the Ethereum (ETH) price has remained in a steady downtrend since mid January, dropping over 45% to nearly $1,800 last week. This decline came about as the broader market remained gripped by fear, as macroeconomic and geopolitical volatility combined with massive recurring liquidations continued to keep investor appetite at bay.
Second, spot Ethereum ETFs, which had previously served as a primary bullish driver, have been witnessing back-to-back outflow months since November of last year. These investment products have shed over $2.5 billion in that period alone, and any further outflows could erode retail confidence and often make traders reevaluate their positions.
Third, the total value locked on the Ethereum network has fallen to $57 billion, which is significantly lower than the $98 billion recorded in October of last year. Declining TVL means reduced on-chain utility and could likely sour the sentiment of traders and hence further dampen the recovery.
On the weekly chart, Ethereum price has confirmed a head and shoulders pattern as it fell below a key support level at $2,800 last month. The pattern is formed of three distinct peaks, where the middle peak is the highest, and the two outside peaks are relatively equal in height. It is widely considered one of the most popular bearish reversal patterns in technical analysis.
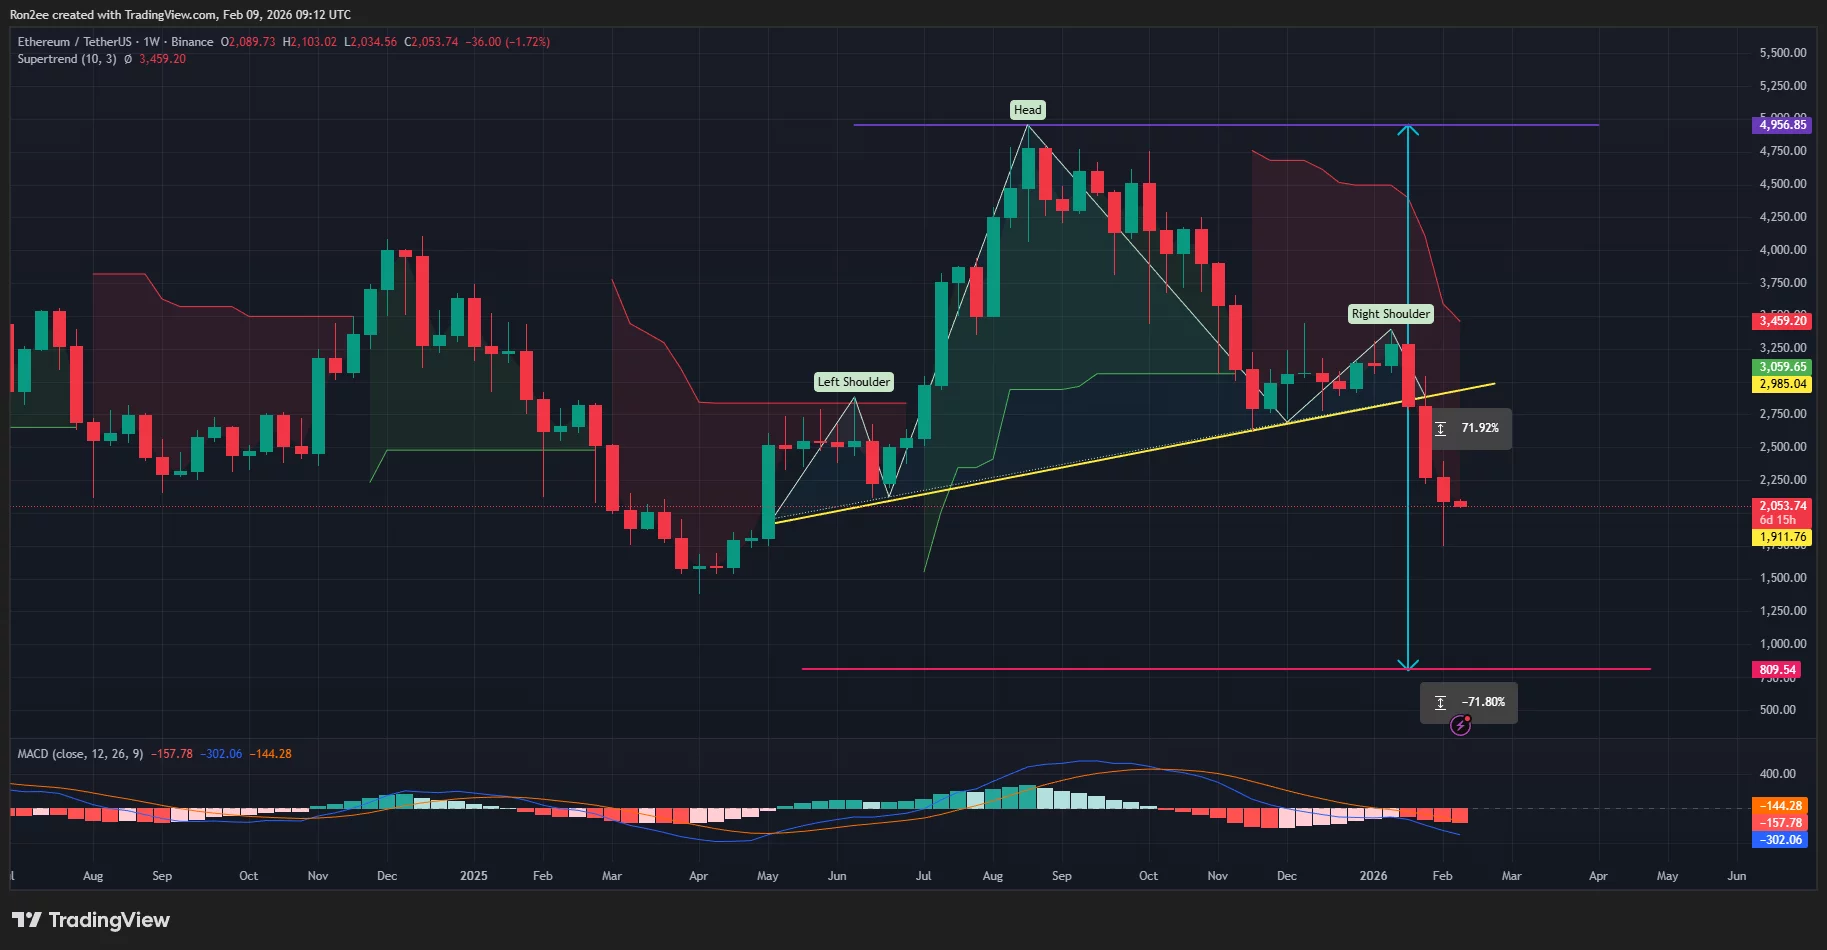
At press time, the Ethereum price was trading close to $2,000, which is another key psychological support level that could largely dictate market sentiment for weeks to come.
A sharp drop below this crucial floor could trigger a deeper slide toward $1,000, which represents the next major historical support. Prices could even fall as low as $800, a bearish target calculated by subtracting the total height of the head from the point at which the price broke below the neckline of the pattern.
Several technical indicators seem to support this grim prediction. Notably, the MACD lines remain stuck under the zero line and are currently pointing downward, indicating strong selling momentum, while the supertrend indicator has flashed a clear red signal.
Disclosure: This article does not represent investment advice. The content and materials featured on this page are for educational purposes only.