
Bitcoin price is showing signs of exhaustion as it reacts more strongly to Nasdaq losses than rallies.
Summary
- Bitcoin falls harder than Nasdaq gains, showing a bearish skew.
- Capital rotation to tech and weaker crypto liquidity amplify downside risk.
- Key support is $98K, resistance $107K, with mixed momentum signals.
Bitcoin is showing signs of fatigue despite trading above $100,000 psychological level.
A Nov. 13 report from market maker Wintermute suggests the world’s largest cryptocurrency is reacting more strongly to declines in the Nasdaq-100 than to its rallies, a bearish skew that points to investor exhaustion rather than euphoria.
Bitcoin mirrors Nasdaq pain, not its gains
Wintermute notes that Bitcoin’s correlation with the Nasdaq remains high at about 0.8, but the way it reacts to moves in the stock index has changed. When equities drop, Bitcoin tends to fall harder. When they rise, Bitcoin’s reaction is muted.
This pattern, known as negative performance skew, was last seen during the 2022 bear market. It often shows exhaustion at market bottoms rather than strength near tops. The report highlights two main reasons for this shift.
First, institutional and retail capital have rotated away from cryptocurrency as investor focus has shifted to mega-cap tech stocks. Second, crypto liquidity has weakened due to a slowdown in stablecoin issuance, a decline in exchange-traded fund inflows, and a lack of market depth.
When stocks retreat, these factors amplify downward movements, making Bitcoin more sensitive to pain than optimism.
Bitcoin has held up better than expected despite this. It’s less than 20% below its peak, indicating that underlying confidence in the asset’s long-term strength is still strong even though sentiment is muted.
Bitcoin price technical outlook
Bitcoin is trading at $103,615 with moderate buying activity. The digital asset positioned below the midline of its Bollinger Bands, suggesting a cautious market sentiment. Most moving averages indicate a slight bearish bias, but the relative strength index, which is close to 43, shows neutral momentum.
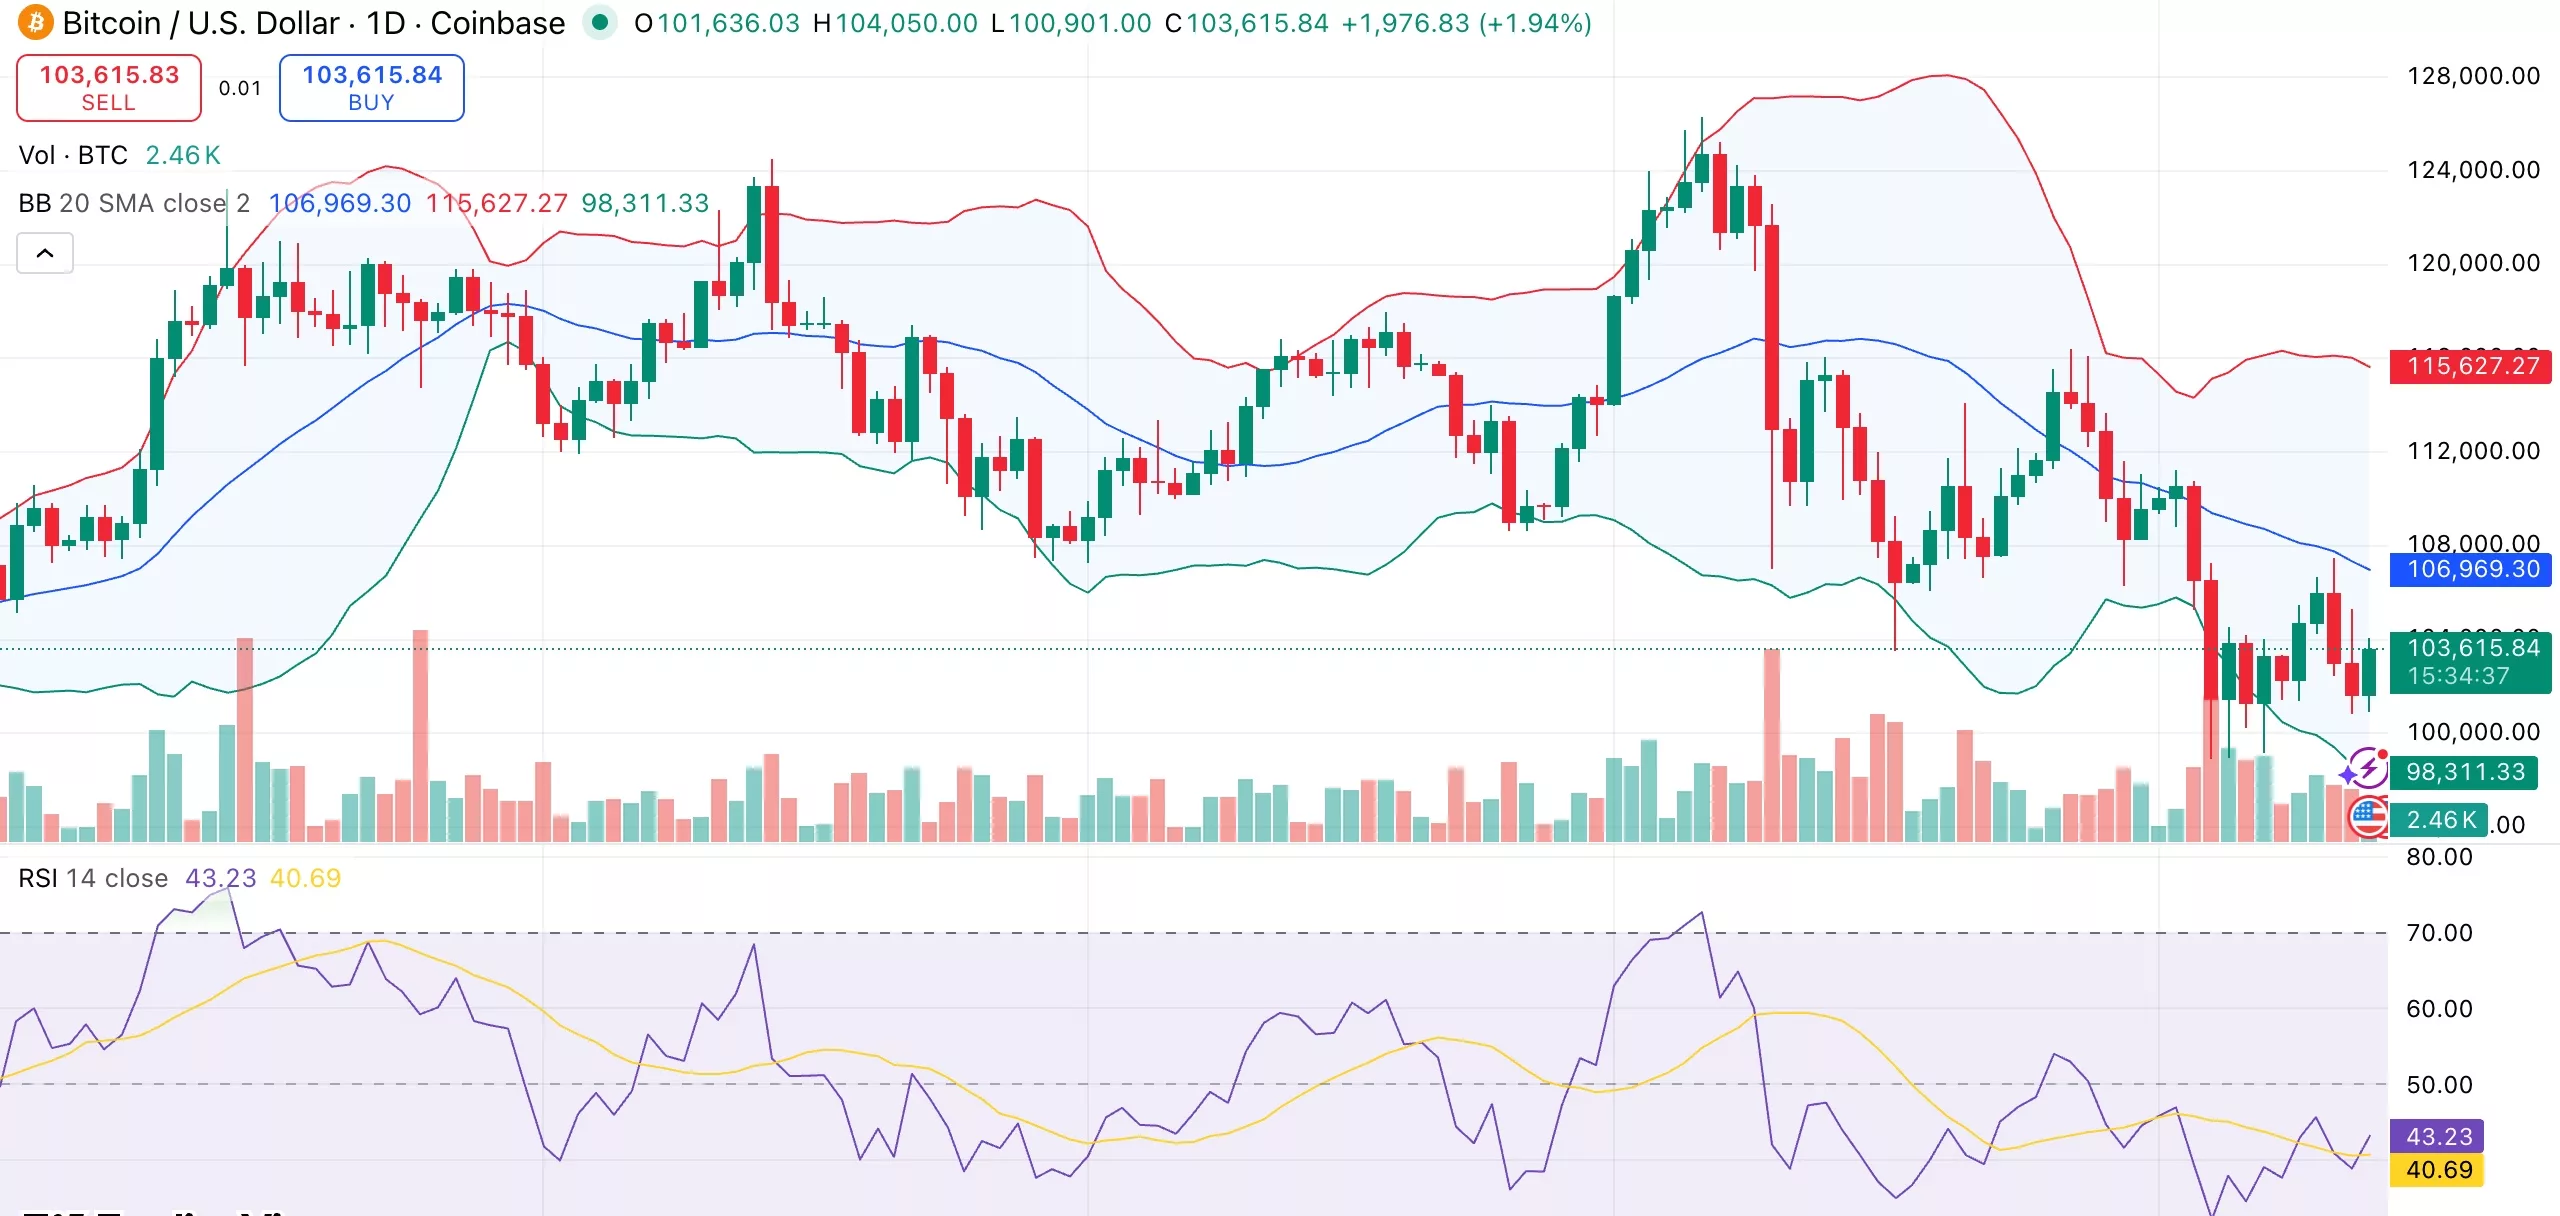
Momentum indicators give mixed signals. Although the MACD shows selling pressure, the Momentum (10) indicator flashes a buy signal, suggesting the potential for a brief rebound if general sentiment stabilizes.
Short-term resistance is located at $107,000, marked by the 20-day simple moving average, while support is near the lower Bollinger Band at $98,000. A strong close above $107,000 could open the door for a push towards $110,000, but failing to hold $100,000 could invite a more substantial correction.