After two brief days of inflows, Ethereum ETFs are back in the red as price remains volatile.
Summary
- Ethereum ETFs recorded $81.44M in net outflows on Oct 29, reversing a short-lived inflow streak.
- Fidelity’s FETH led with the largest outflow at $69.49M while only BlackRock’s ETHA saw positive inflows of $21.36M.
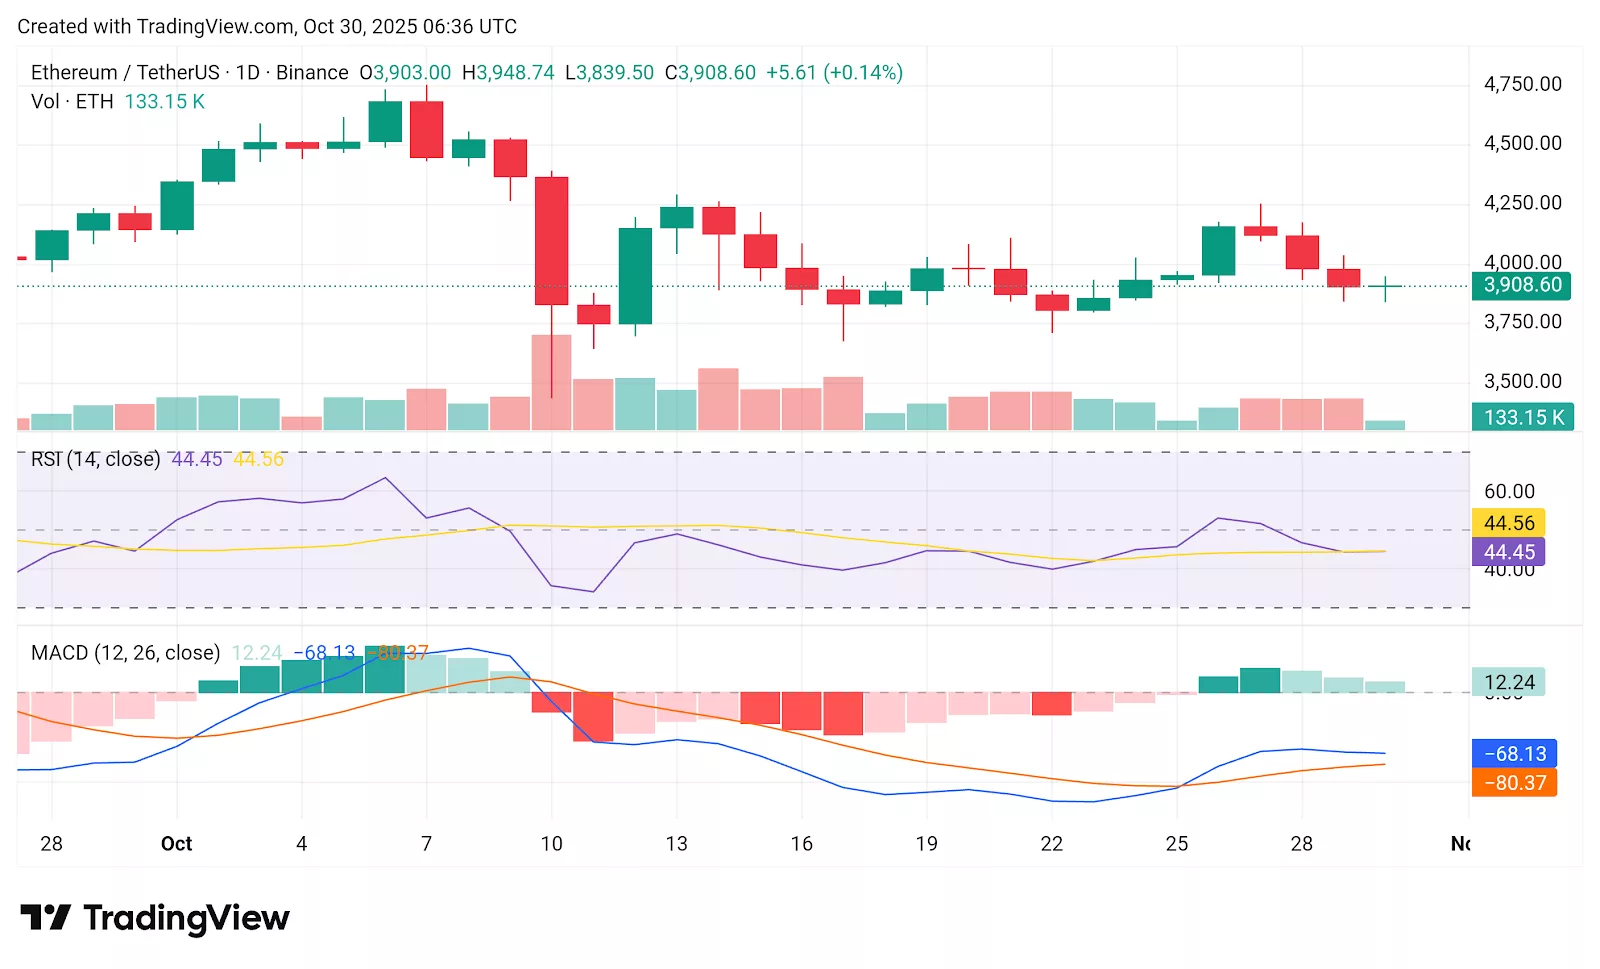
- RSI at 44.45 and MACD at -68.13 suggest weakening bullish momentum.
- ETH needs to close above $4,000 to regain strength; otherwise, a drop to $3,850 or $3,750 is possible.
Ethereum ETFs have returned to outflows, recording a total of $81.44 million on October 29 per SoSovalue data. The return to outflows comes after the spot ETFs recorded two consecutive days of inflows totaling $379.93 million, suggesting investor sentiment is weakening.
Among the issuers, Fidelity’s FETH led the highest outflow on Oct 29 with $69.49 million. Following behind was Grayscale’s ETH and ETHE, posting net outflows of $16.18 million and $12.83 million respectively. VanEck’$ ETHV posted the lowest outflow of $4.31 million while BlackRock’s ETHA had the only inflow of $21.36 million.
The mixed performance shows increased selling pressure from investors who could be taking profit to minimize exposure. On the other hand, four issuers recorded zero activity. These include Bitwise’s ETHW, Franklin EZET, 21Shares TETH, and Invesco QETH.
The shift to outflows comes amid broader market caution. Bitcoin ETFs fared even worse, with total net outflows reaching approximately $470.7 million, ending their four-day inflow streak, suggesting significant profit-taking.
Ethereum ETFs lose momentum as ETH price remains volatile
The recent outflow in the exchange-traded funds comes as the ETH (ETH) itself suffers multiple sessions of indecision near the key $4,000 resistance level. Ethereum trades at $3,908 at press time with a 24H loss of 2.89% and a 7D gain of 2.82%, per crypto.news.
The price action reveals consolidation after the recent dip from around $4,250, with daily candles showing lower highs, a signal that buying pressure is fading. Technical indicators show a market stuck in consolidation.
The Relative Strength Index (RSI) reads 44.45, nearly flat with its signal line at 44.56, confirming a neutral-to-bearish bias. This range suggests that neither bulls nor bears have decisive control, but sellers maintain a slight upper hand as the RSI remains below the midpoint of 50.
The MACD (Moving Average Convergence Divergence) reinforces this view, as the MACD line at -68.13 remains below the signal line at -80.37. For ETH to regain strength, it must reclaim and close decisively above $4,000, which could trigger renewed bullish momentum toward $4,150–$4,200.
Failure to do so could result in a pullback toward $3,850 or even $3,750, where stronger demand previously emerged. With ETF flows turning negative again and market indicators signaling fatigue, Ethereum’s next move could hinge on whether bulls can reclaim key price levels before sentiment worsens.