XRP price is drawing fresh attention as momentum builds around a pivotal zone that has repeatedly shaped trading this year.
Summary
- XRP price is testing the crucial $2.63 to $2.70 resistance range after a strong weekly gain, with renewed market optimism and institutional flows boosting momentum.
- Recent developments, including Yellow Network’s XRPL EVM sidechain integration and Ripple USD surpassing a $900 million market cap, are strengthening on-chain and ecosystem fundamentals.
- Technical indicators point to a bullish structure, with a confirmed hold above $2.70 likely paving the way for a move toward $3 and potentially $3.60 if momentum continues.
At the time of writing, XRP price trades at $2.66, up 1.5% over the last 24 hours and 9.2% on the week, according to market data from crypto.news. This uptick, which aligns with a broader market lift, has carried the token into the $2.63 to $2.70 range.
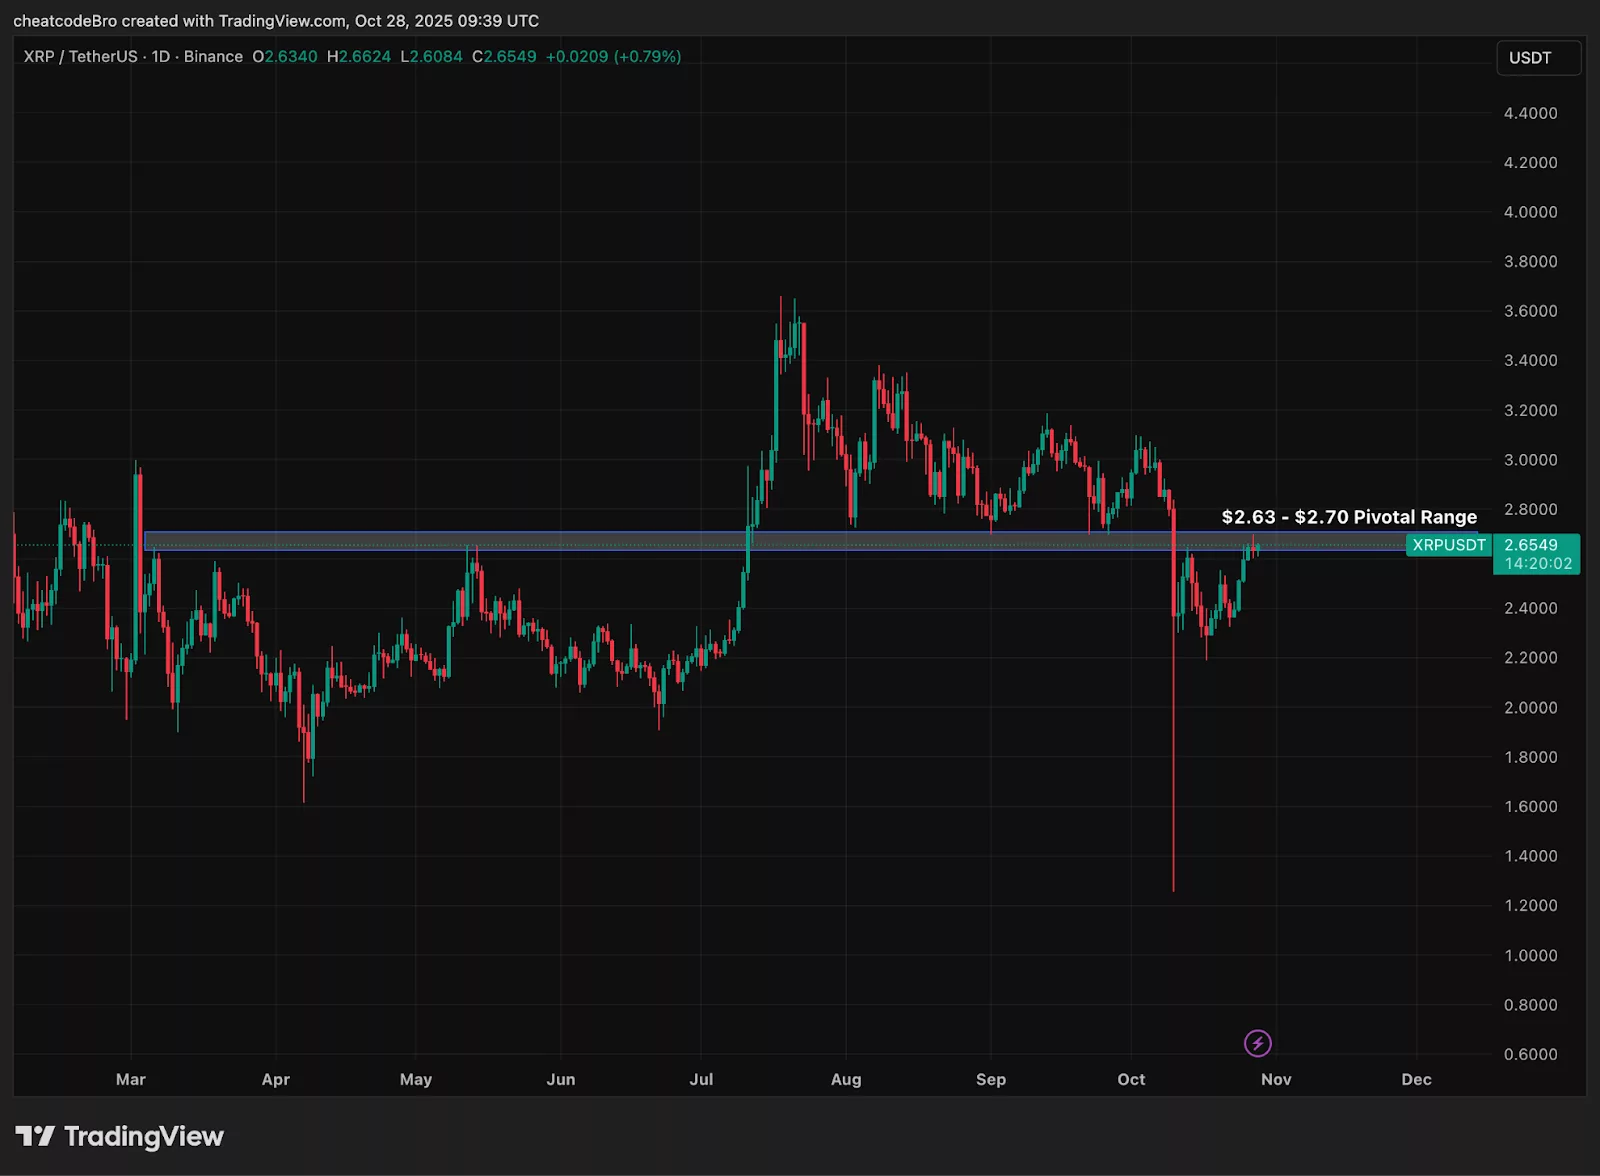
The area has acted as a decisive band since earlier in the year, flipping between resistance and support across multiple tests on the daily chart. With XRP (XRP) price probing this zone for the second time in October, attention is fixed on whether it can finally secure acceptance above it.
Fresh fund flows and derivatives positioning have added fuel, with a recently launched spot XRP ETF crossing roughly $100 million in assets as CME futures open interest climbs to multi‑month highs, signaling deeper institutional participation.
Meanwhile, Ripple USD (RLUSD) has surpassed a $900 million market cap, reflecting growing activity across the ecosystem. Along with rising spot-ETF assets and higher CME futures open interest, these developments signal increasing institutional participation and give the token more momentum to push past the key price zone.
XRP price breakout gathers pace as buyers target $3
The Ripple token broke out of a symmetrical triangle after several days of consolidation, pushing into the $2.63 pivot band that has capped its price since mid‑October. The breakout candle sits above the triangle’s upper trendline and keeps buyers in control intraday.
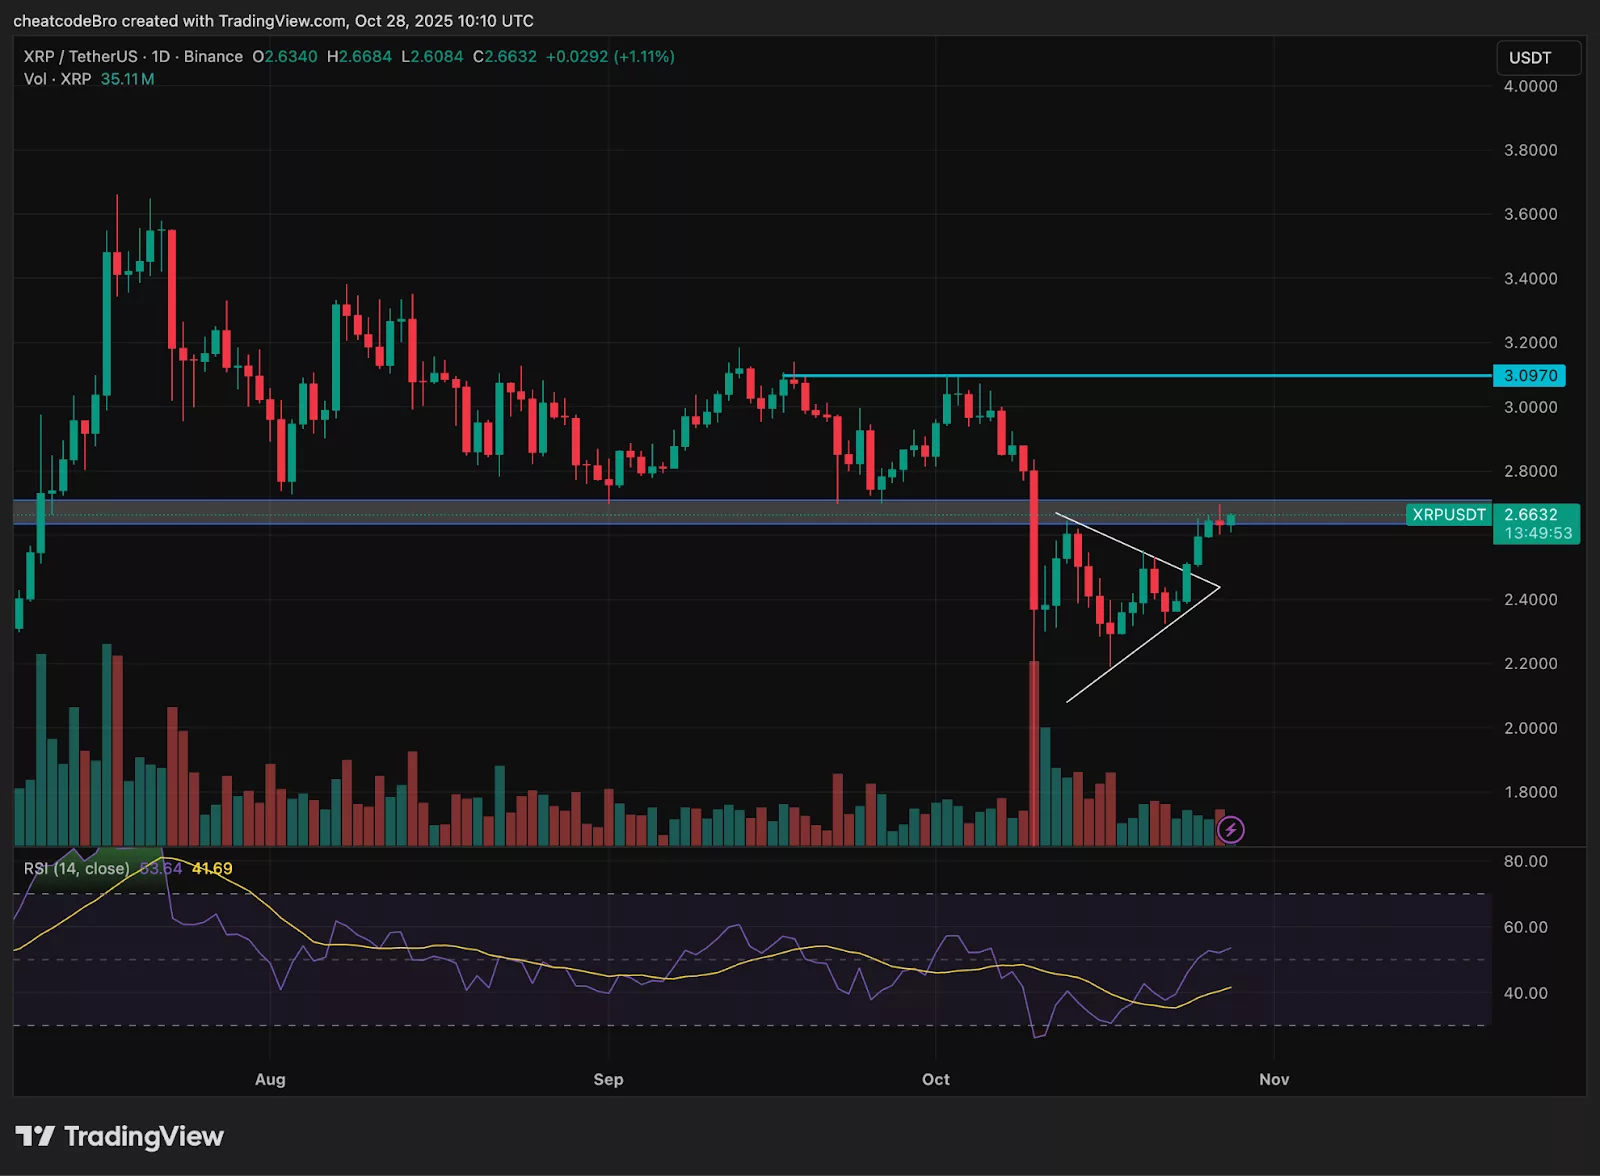
The relative strength index (RSI) hovering near 54 and rising, indicates the momentum after the compression phase is increasing. Volume remains active around 35M on the day, supporting the validity of the move rather than a weak fake‑out.
A firm daily close and hold above $2.70 would open a clean run toward $3 with $3.09 the next marked resistance. From there, a routine pullback to retest $2.70 as support would be healthy and could set a stronger base for continuation.
If $2.70 flips to support on that retest, the next measured push points to the $3.60 region, aligning with the range ceiling set in July. Conversely, failure to hold $2.63 would neutralize the breakout and risk a slide back toward $2.45 as momentum fades.