
Bitcoin price rose for the second consecutive day on Monday, Sept. 29, as traders waited for key details on the U.S. government shutdown, Donald Trump’s tariffs, and the closely watched nonfarm payrolls data.
Summary
- Bitcoin price has formed a double-bottom chart pattern on the daily chart.
- The US government could go through a shutdown on Monday this week
- The next important catalyst will be the upcoming US non-farm payrolls data on Friday.
Bitcoin (BTC) jumped to a high of $114,000, much higher than last week’s low of $108,450. It has jumped by 55% from its lowest level this year.
US government shutdown, Donald Trump’s tariffs, and NFP data
Bitcoin price will have three key catalysts this week. The first one is a potential government shutdown in the United States, which will happen on October 1 unless Congress agrees on a spending resolution.
Donald Trump will meet with congressional leaders to resolve the deadlock as Republicans and Democrats maintain hardline positions.
If a shutdown occurs, nonessential services like national parks and IRS operations will close, and about 40% of the federal workforce will be furloughed.
The impact on the economy will depend on duration. A prolonged shutdown would weigh on output and could pressure the Federal Reserve to cut interest rates.
Another catalyst for Bitcoin will be the ADP and Bureau of Labor Statistics nonfarm payrolls numbers. Economists expect the data to show the labor market remained subdued as companies grappled with Trump’s tariffs.
A weak jobs report would be bullish for Bitcoin, as it would raise the likelihood of interest-rate cuts by the Federal Reserve in the last two meetings of the year. However, while the ADP report will be released, the official NFP report may not be published if the government shuts down.
The other important catalyst that may move Bitcoin price is the uncertainty on trade after Trump threatened to impose substantial tariffs on furniture and all movies made outside of the United States. This is in addition to the tariffs on imported pharmaceutical drugs that he threatened last week.
Bitcoin price technical analysis
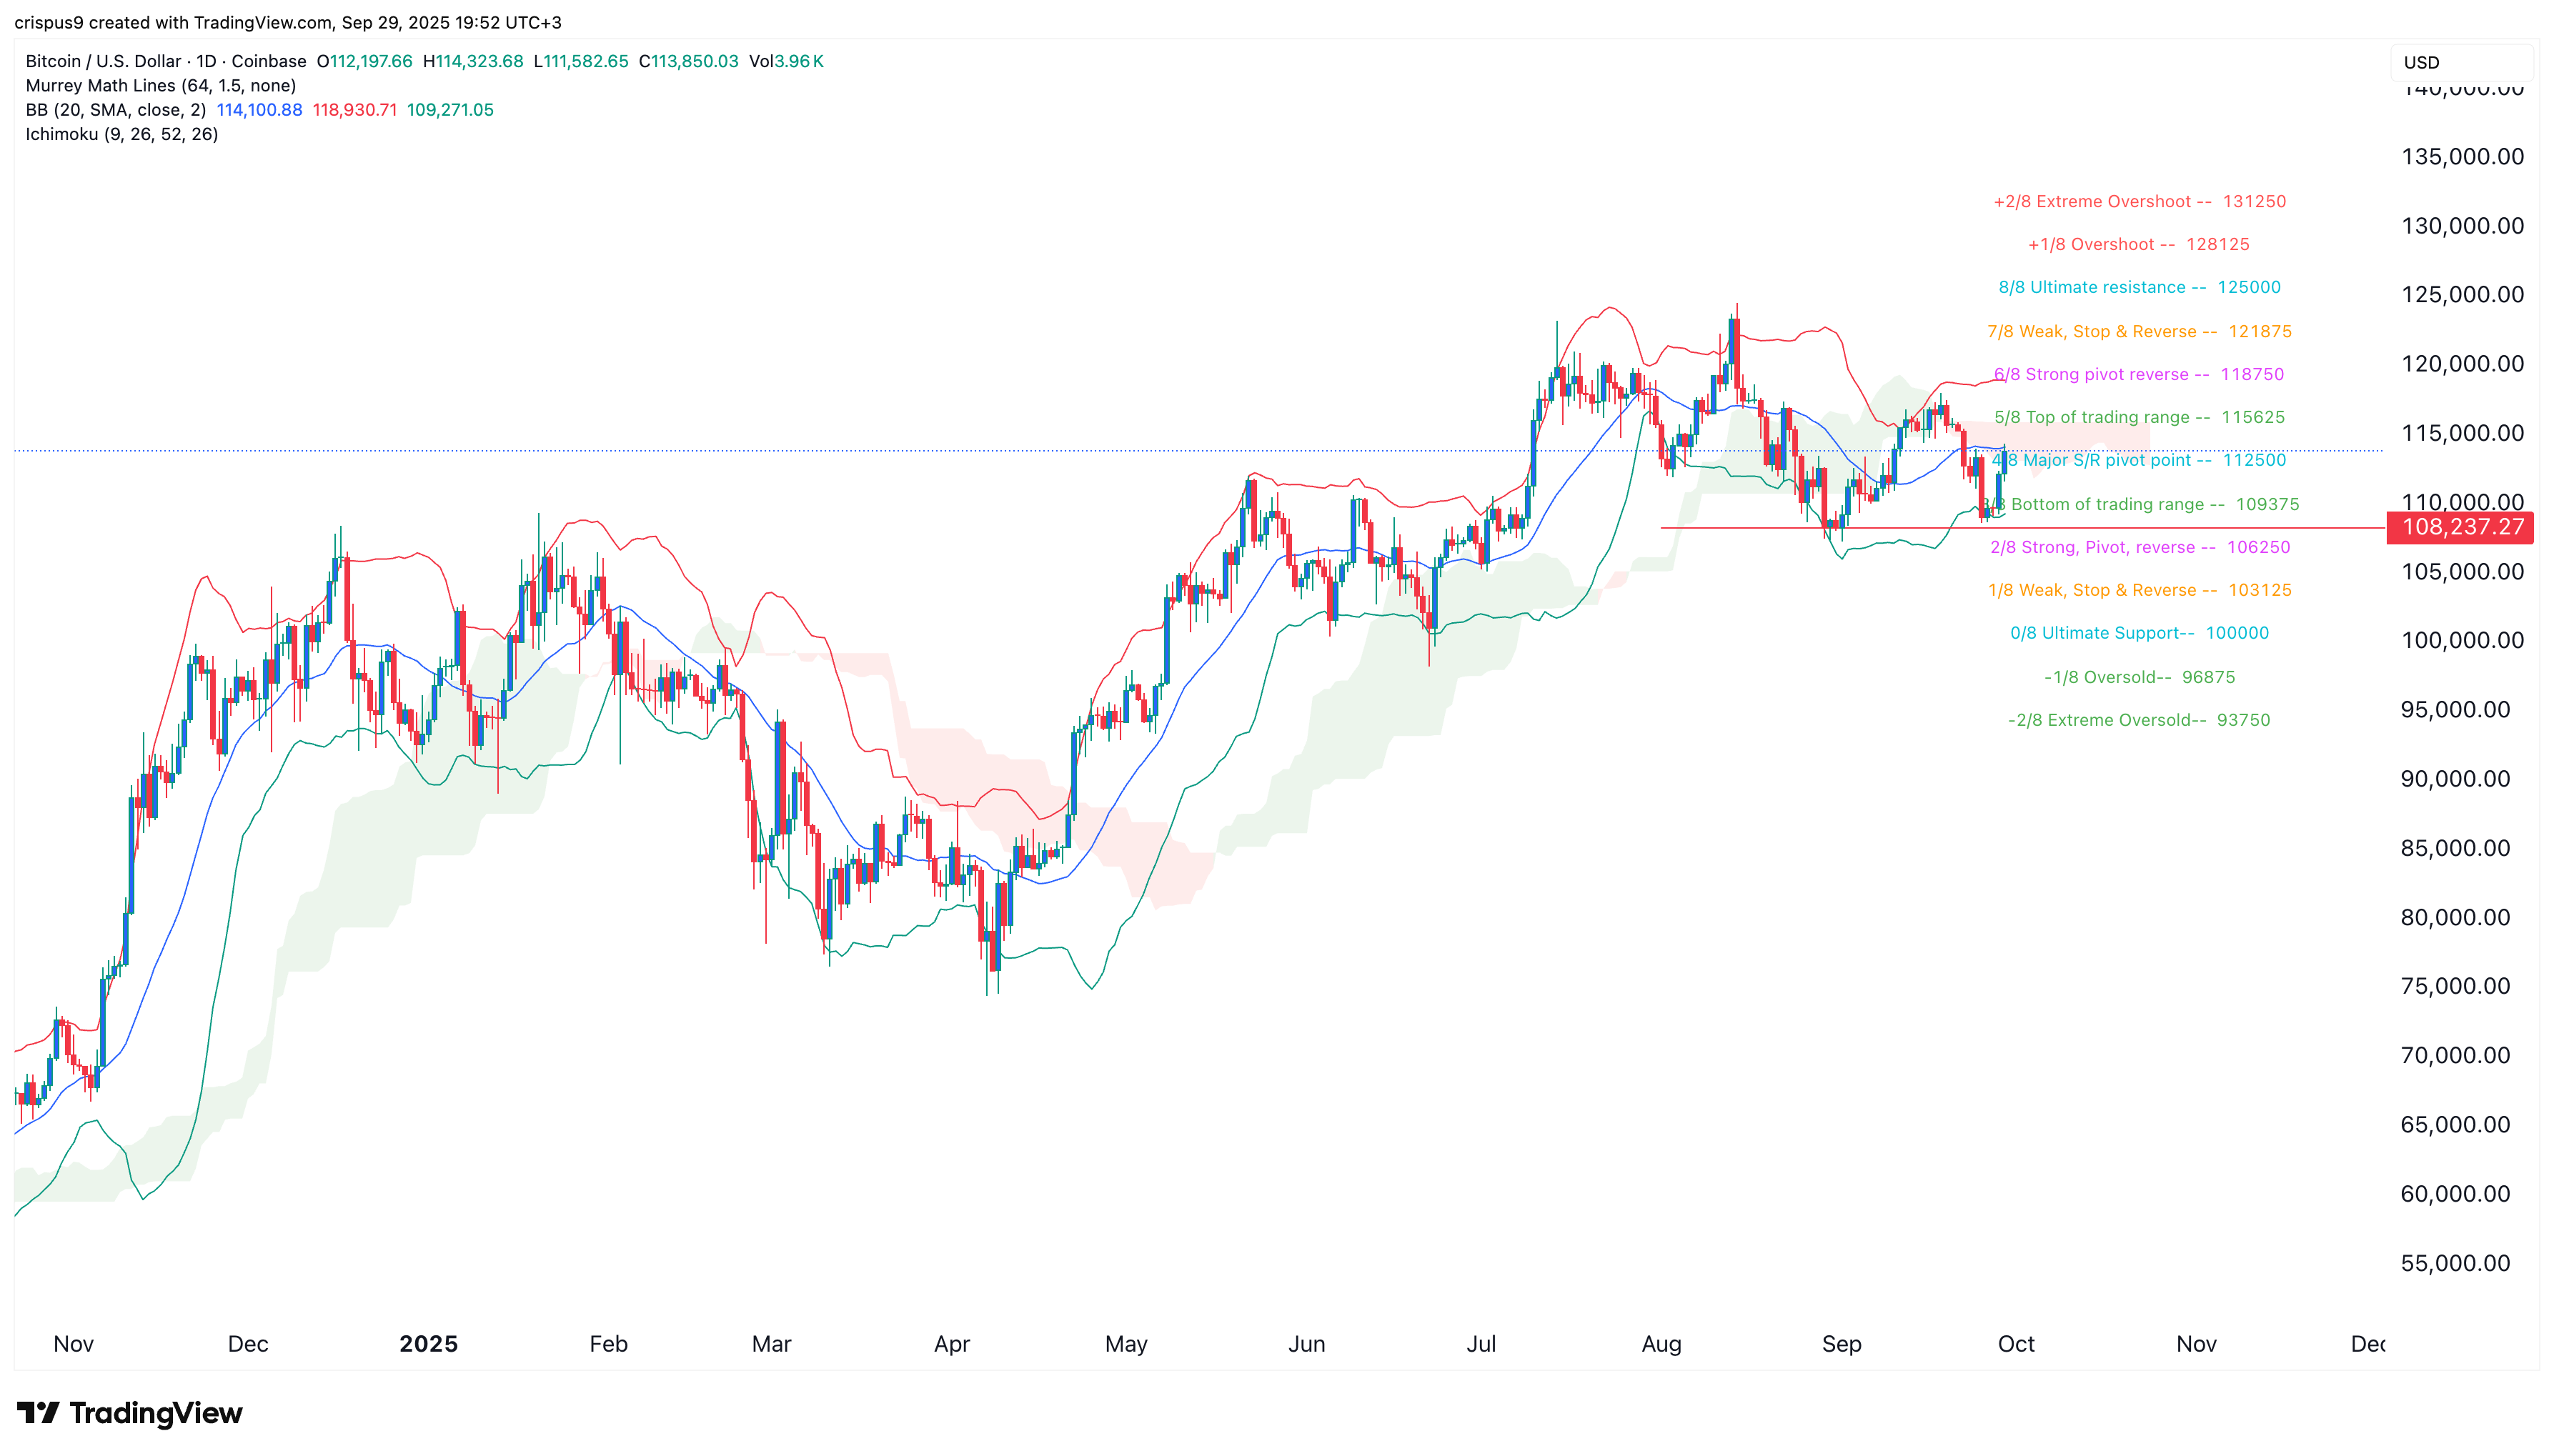
The daily timeframe chart shows that Bitcoin has formed a double-bottom pattern at $108,236, one of the most common bullish reversal patterns in technical analysis.
Bitcoin has moved above the major S/R pivot point of the Murrey Math Lines at $112,500. It has remained above the 100-day exponential moving average and the middle line of the Bollinger Bands.
Bitcoin has moved inside the Ichimoku Cloud indicator. Therefore, the coin will likely continue rising as bulls target the strong pivot reversal point at $118,750. A drop below support at $108,236 would invalidate the bullish forecast.