
Bitcoin price is facing renewed pressure after on-chain data flagged by Lookonchain revealed that a major whale has moved roughly 10,000 BTC to Binance over the past two days, raising concerns of potential selling activity.
Summary
- Lookonchain flagged a Bitcoin whale moving nearly 10,000 BTC to Binance over two days, raising concerns of potential sell pressure.
- Bitcoin is trading around $66,900, well below its 50-day SMA near $85,000, confirming a strong short-term downtrend.
- Key support sits at $65,000 and $60,000, while resistance stands at $72,000 and $78,000–$80,000, with indicators still showing mild capital outflows.
The most recent transfer involved 2,035 Bitcoin (BTC) worth about $135 million. In total, the whale has deposited around 8,200 BTC in 48 hours, bringing cumulative recent inflows close to the 10,000 BTC mark.
Lookonchain warned traders that previous deposits from the same wallet were followed by short-term price drops, including a decline of more than 3% shortly after a prior alert.
Large exchange inflows are often interpreted as potential sell signals because coins moved to centralized platforms become immediately liquid. While deposits do not guarantee selling, the timing has raised caution among traders already navigating a fragile technical setup.
Bitcoin price analysis and forecast
On the daily chart (BTC/USDT), Bitcoin is currently trading near $66,900, well below the 50-day simple moving average at $85,012. The sharp gap between price and the 50 SMA signals a strong prevailing downtrend.
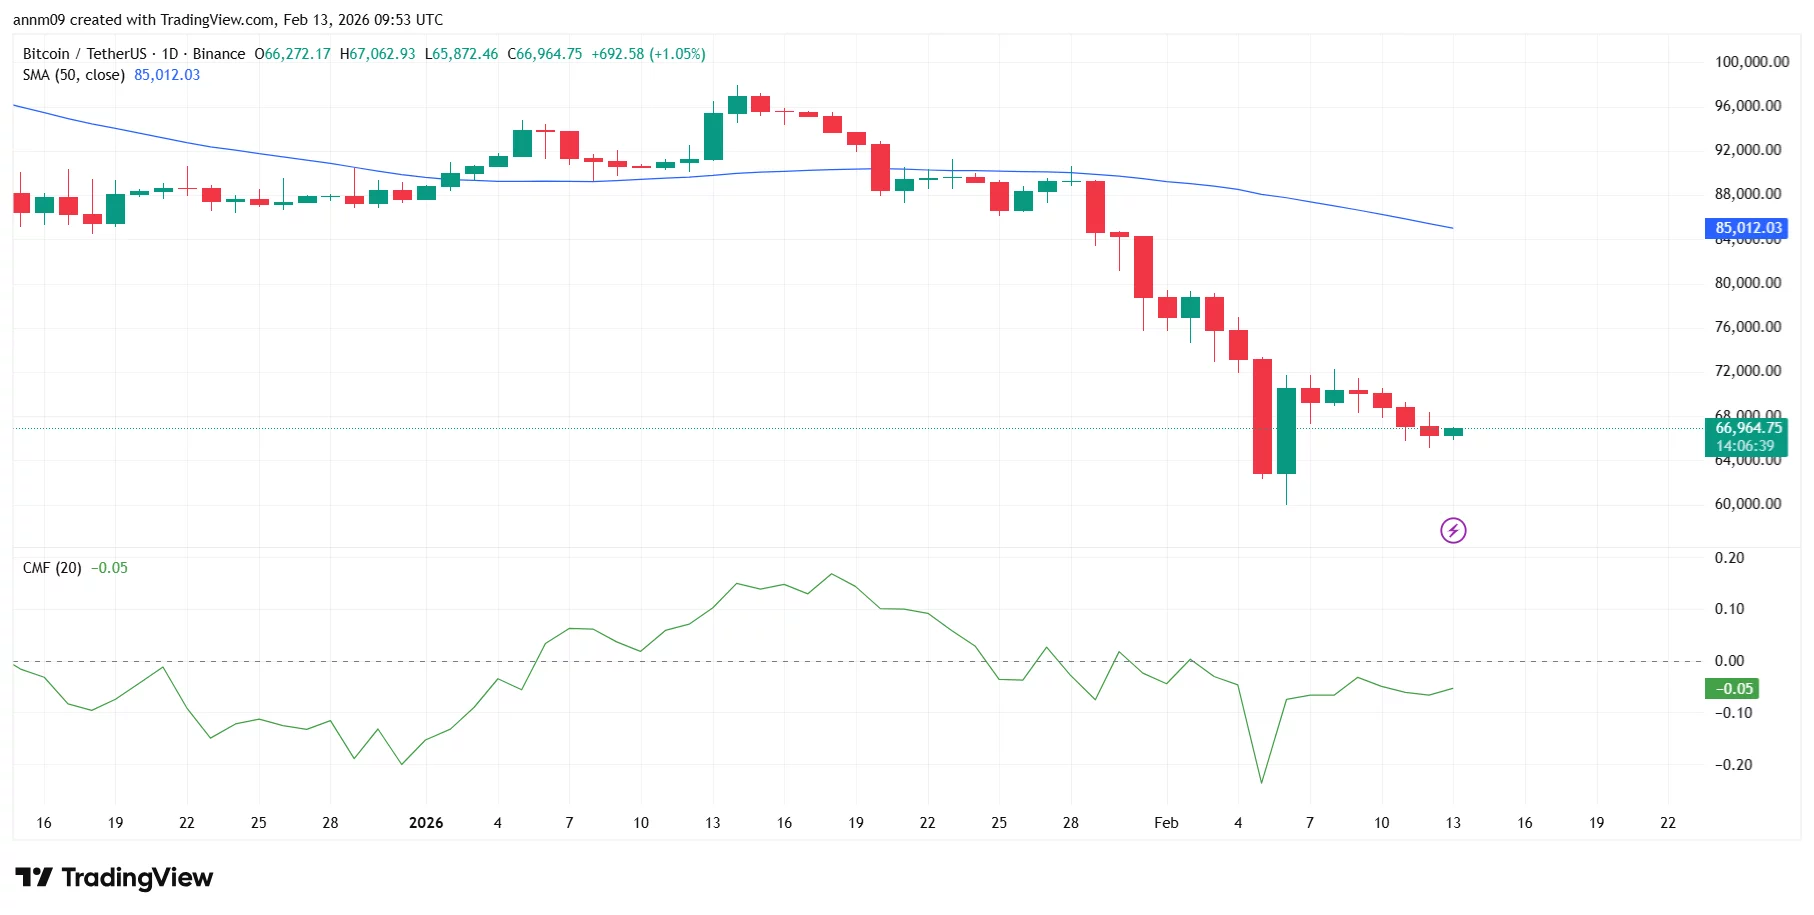
Price recently plunged toward the $60,000–$62,000 zone, printing a long lower wick before bouncing. That area now stands as critical support. A daily close below $60,000 could open the door toward the psychological $55,000 region.
Immediate support sits around $65,000, which price is currently testing. If this level fails, bears may attempt another push toward the recent lows.
On the upside, resistance is forming at $72,000, where recent recovery attempts stalled. A stronger resistance cluster lies between $78,000 and $80,000, followed by the 50-day SMA near $85,000, which now acts as dynamic resistance.
The Chaikin Money Flow (CMF) indicator sits slightly negative at around -0.05. While it has recovered from deeply negative territory, it still suggests capital outflows remain dominant. Sustained movement above the zero line would be needed to confirm renewed buying pressure.
If whale deposits translate into spot selling, Bitcoin could retest the $60,000 support zone. However, if $65,000 holds and exchange inflows fail to trigger heavy liquidation, a short-term rebound toward $72,000 is possible.
For now, the trend remains bearish unless Bitcoin reclaims levels above $80,000 and closes back above its 50-day moving average.