
HBAR price is consolidating below key resistance as an inverse head and shoulders pattern develops, signaling a potential bullish breakout if the neckline resistance is cleared with volume.
Summary
- Inverse head and shoulders pattern developing, signaling trend reversal potential
- $0.09 neckline resistance is the key trigger for bullish confirmation
- Holding above the point of control supports a breakout toward higher targets
HBAR (HBAR) price action is showing increasingly constructive behavior as the market builds a classic bullish reversal structure on the higher timeframes. After an extended corrective phase, price has stabilized and begun forming an inverse head and shoulders pattern, a formation often associated with trend reversals when confirmed by a breakout above resistance.
This structure is developing just beneath a key high-timeframe resistance level, placing HBAR at a critical inflection point. With price holding above key value levels and volume remaining supportive, the technical setup suggests that bullish momentum may be building beneath the surface.
HBAR price key technical points
- Inverse head and shoulders pattern is forming, signaling potential trend reversal
- Neckline resistance sits near $0.09, a key high-timeframe level
- Price is holding above the point of control, supporting breakout conditions
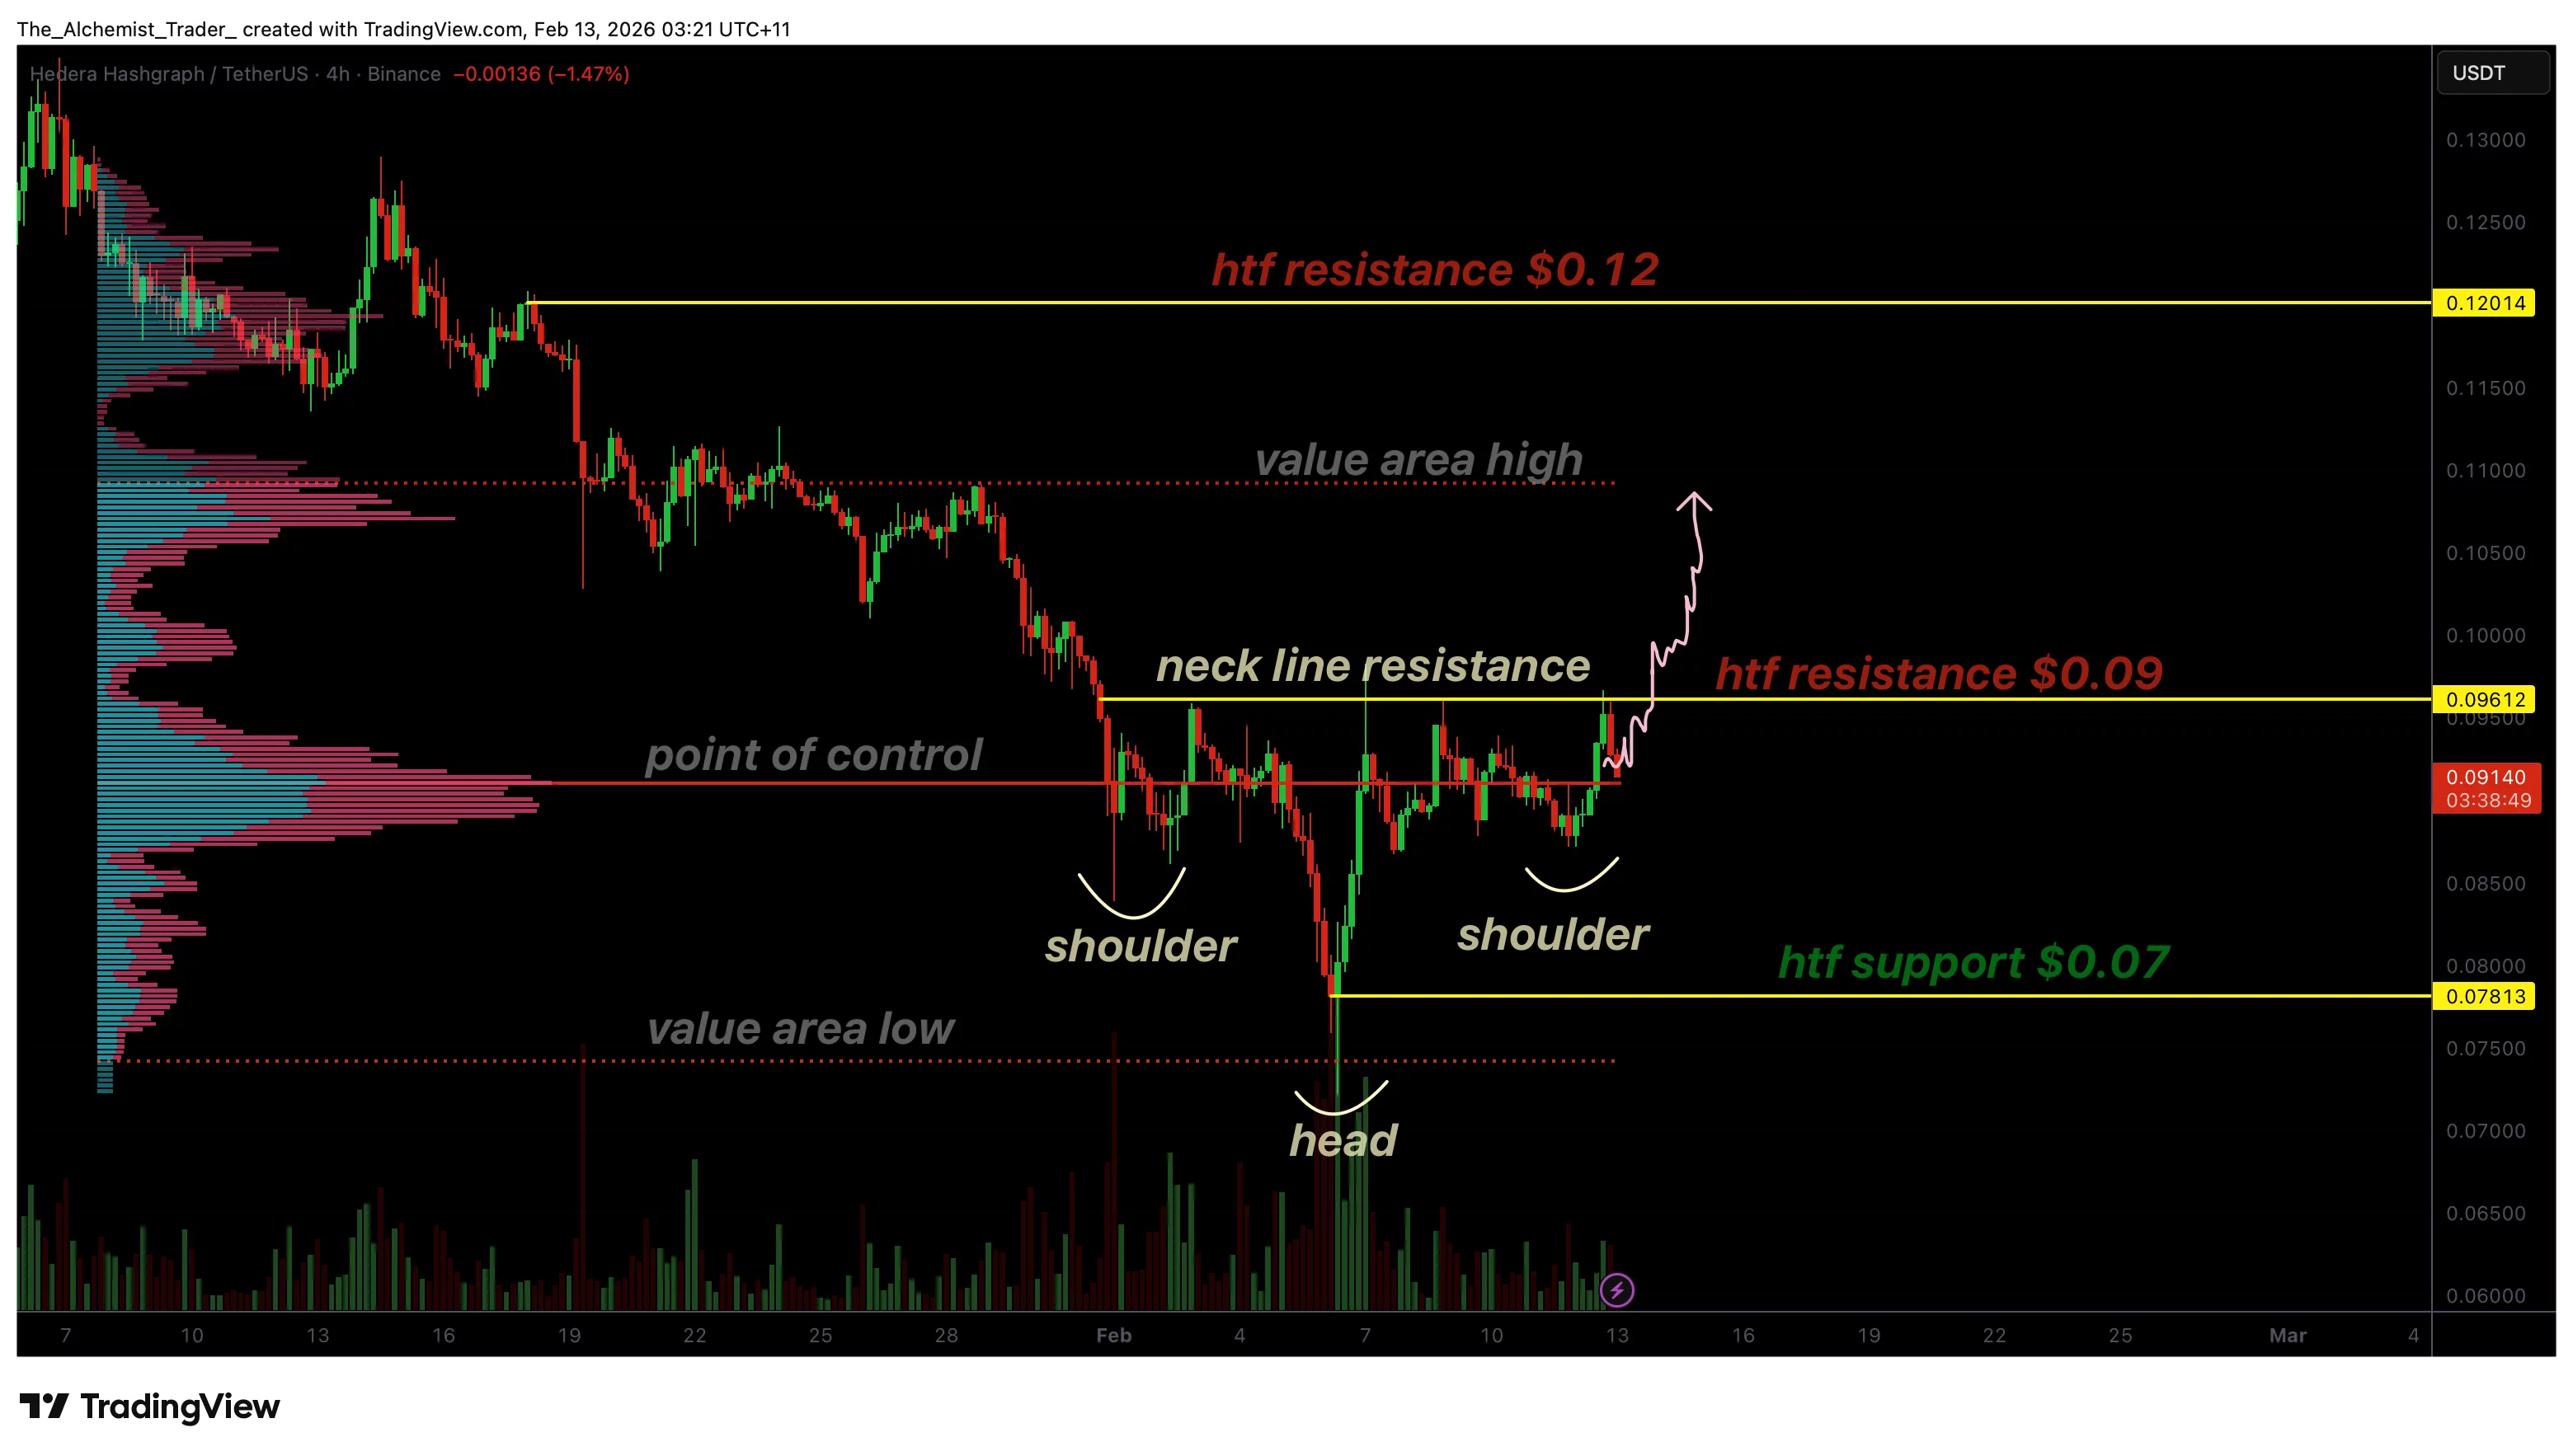
HBAR’s recent price action has carved out a well-defined inverse head-and-shoulders pattern, consisting of a left shoulder, head, and right shoulder. This structure typically forms after sustained downside pressure and reflects a gradual shift in control from sellers to buyers.
The neckline of this pattern is clearly defined near the $0.09 level, which also aligns with a high-timeframe resistance zone. This confluence strengthens the importance of the level, as a breakout above the neckline would represent both a pattern confirmation and a structural shift.
Throughout the formation, price has respected higher lows, indicating that downside momentum is weakening and buyers are increasingly willing to step in earlier.
Volume and point of control support the setup
One of the more constructive aspects of HBAR’s setup is how volume behaves during consolidation. Price is currently trading above the point of control, where the highest concentration of traded volume has accumulated. Holding above this level suggests acceptance at higher prices and reinforces the bullish narrative.
In reversal structures, accumulation beneath resistance is often a precursor to expansion. The fact that volume has remained healthy, rather than declining, indicates sustained participation and reduces the risk of a false breakout.
Additionally, a key swing low has formed near the value area low, further supporting the idea that demand is building at higher levels rather than allowing price to rotate lower.
Breakout conditions and upside targets
For the bullish scenario to fully play out, HBAR must break above the neckline resistance near $0.09 with a clear bullish influx. A decisive close above this level, with expanding volume, would confirm the inverse head-and-shoulders pattern and signal a shift in market structure.
If confirmed, the next upside target would be the value area high, followed by the broader high-timeframe resistance around $0.12. These levels represent natural areas where price may pause or consolidate following a breakout.
Importantly, a breakout without volume confirmation would increase the risk of a failed move. As such, volume behavior remains a key variable to monitor.
What to expect in the coming price action
From a technical, price action, and market structure perspective, HBAR is approaching a pivotal moment. As long as price remains above the point of control and continues to build higher lows, the inverse head and shoulders pattern remains valid.
A successful breakout above $0.09 would likely trigger a bullish expansion toward higher resistance zones. Conversely, failure to break and hold above the neckline could result in extended consolidation or a rotation back toward lower value levels.