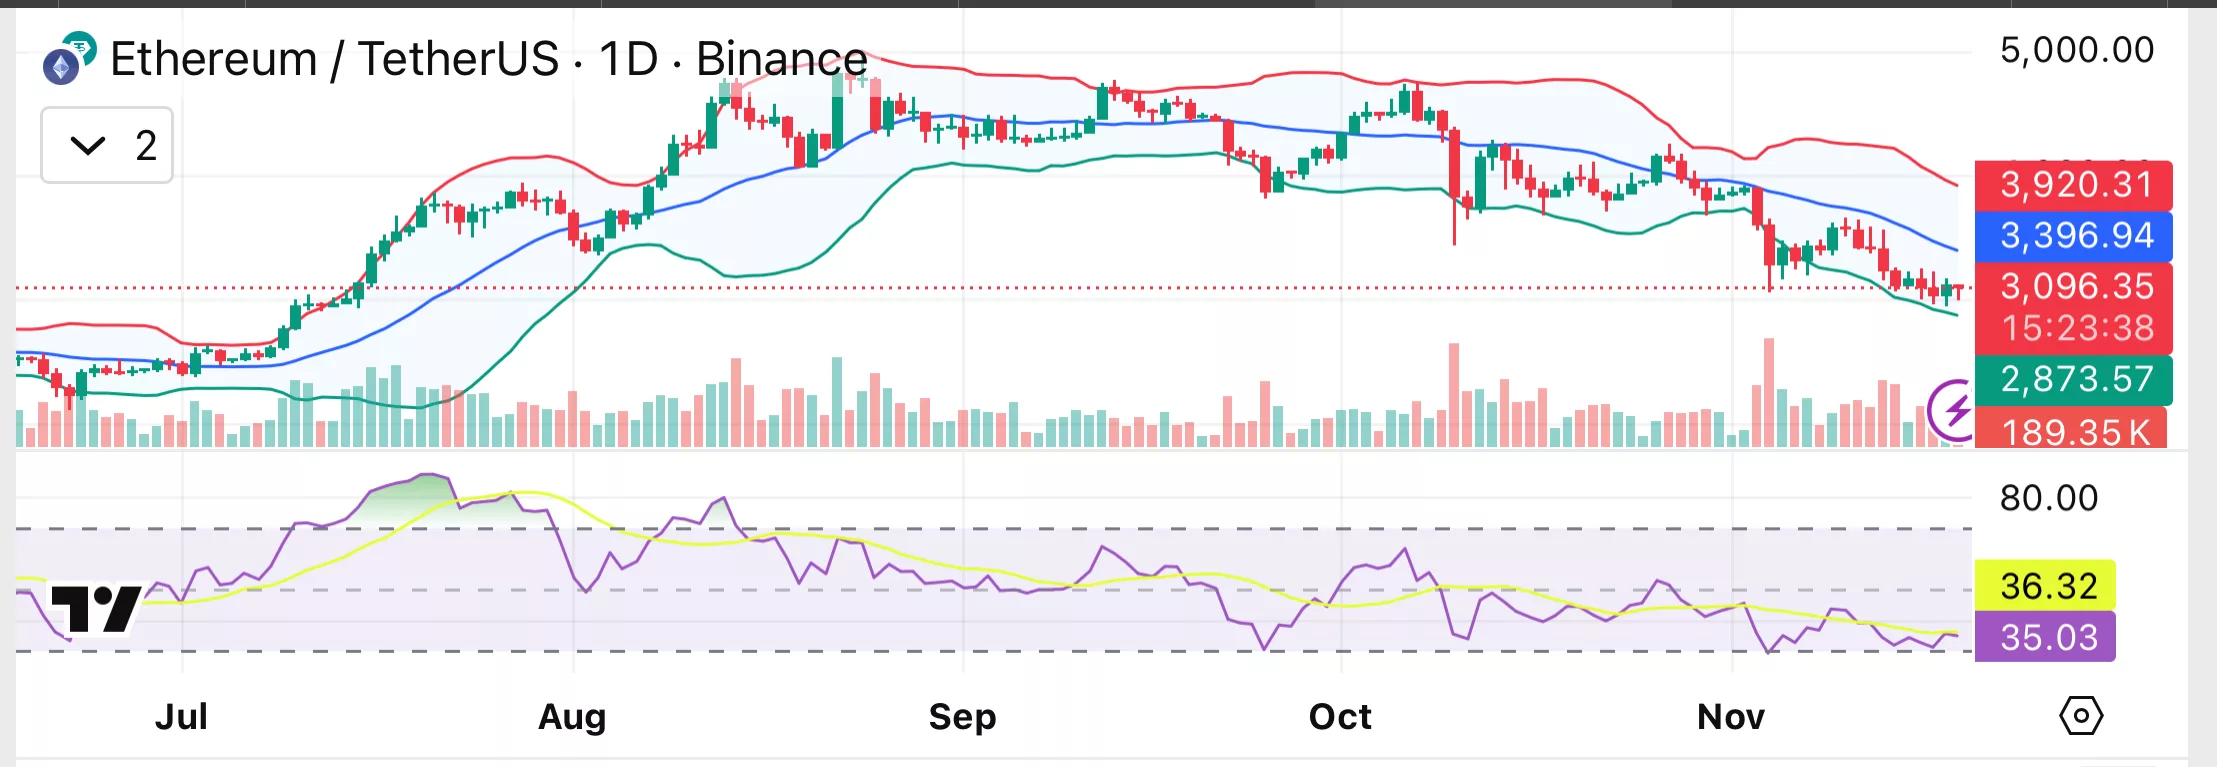
Ethereum price is at a crossroad, showing only faint signs of stability as traders pull back and market activity thins.
Summary
- Ethereum trades near key support with weakening momentum and falling volumes.
- Record-high leverage and major Binance inflows raise liquidation risks.
- Technical indicators show a firm downtrend with key support at $3,000.
After the recent decline, Ethereum was trading at $3,079 at press time, showing weakness despite a 1% daily gain. The asset is now 37% below its August all-time high, down roughly 10% over the last week and 24% over the previous month.
In the last 24 hours, Ethereum’s (ETH) trading volume has dropped 30%, suggesting that the latest price moves are occurring with less engagement from market participants.
Derivatives data also shows a slowdown in activity. While futures volume dropped 29%, open interest was largely unchanged. This pattern often arises when traders lower their exposure and are hesitant to take on new positions.
In this setting, price changes are more influenced by current leverage and short-term volatility than by fresh capital entering the market.
Binance leverage and exchange flows add pressure
One key area of concern is Binance’s Estimated Leverage Ratio. According to a Nov. 19 analysis by CryptoQuant contributor Arab Chain, Ethereum’s Binance ELR has risen to a record high near 0.5617. Elevated leverage raises the risk of liquidation-driven swings because even slight price changes can lead to rapid position unwinding.
At the same time, on-chain flows flagged by another CryptoQuant analyst, show a large inflow of roughly 509,900 ETH into Binance. This marks the highest level in nine months. Large deposits from major holders often expand potential selling activity and may put pressure on Ethereum’s price.
When combined with heavy leverage, markets can become sensitive to abrupt shifts in direction. Similar conditions in past cycles have led to fast, disorderly moves once one side of the market begins to unwind.
Ethereum price technical analysis
Ethereum’s daily chart shows a clear downtrend. From the 10-day to the 200-day, the price is currently below all major moving averages, indicating that sellers are still in control. A pattern of lower highs and lower lows suggests that a base has not yet been established in the market.

The relative strength index is at 35, which is close to oversold territory but does not signify total seller exhaustion, even though it is approaching oversold territory.
The MACD and other momentum readings are negative, which supports the notion that sell pressure might continue. While the ADX near 42 indicates that the current trend is fairly strong, the lower Bollinger Band, which is currently directing price action, indicates that sellers are in control.
A key level to monitor is the $3,000 immediate support. A break below this range might pave the way for $2,700 to $2,800. On the upside, regaining the $3,400–$3,600 range would be the first sign that pressure is beginning to ease.
A confirmed recovery would require a move above the 50-day and 100-day moving averages, which are between $3,700 and $4,100.


**mitolyn reviews**
Mitolyn is a carefully developed, plant-based formula created to help support metabolic efficiency and encourage healthy, lasting weight management.