
CME gap keeps Bitcoin’s bounce fragile even as on-chain metrics show holder conviction.
Summary
- CME Bitcoin futures opened a gap that could trigger a quick Bitcoin price pullback if it closes.
- On-chain MVRV and long-term holder behavior point to limited selling pressure.
- Key levels to watch include support around $109k–$111k and resistance close to $115k–$118k level.
Bitcoin is trading at $111,804 at press time, up 2.2% in the last 24 hours. The 7-day range sits between $108,964 and $113,874. BTC is roughly 9.9% below its $124,128 all-time high from August 14. 24-hour spot volume jumped to $38.26 billion, a big rise that shows active buying and selling across exchanges.
On the derivatives side, CoinGlass data shows Bitcoin (BTC) futures volume rose 113% to $56.7 billion while open interest climbed about 1.6% to $78.7 billion. This points to heavier short-term trading and more hands taking positions, but without a large, immediate build in sustained leverage.
Bitcoin CME futures gap adds short-term risk
A fresh factor for traders is the CME futures gap that opened when U.S. futures started trading on Sept. 29. Analyst Daan Crypto Trades noted the gap and warned that if it closes quickly, the short-term structure would look weak and a move below $111,000 would be a serious negative.
Historically CME gaps often close in short order, which is why many desks are watching $111,000 as the line that matters for near-term risk.
At the same time, on-chain indicators point to resilience beneath the surface. CryptoQuant contributer XWIN Research Japan noted on Sept. 28 that the MVRV ratio sits near 2.0, a level that signals neither panic nor euphoric excess. Long-term holders are not selling in material amounts, which tightens available supply and supports price stability.
Put together, this shows that while short-term risks exist due to the CME gap, the broader cycle remains healthy.
Bitcoin price technical analysis
The daily chart shows Bitcoin trading inside a range after the August run. The 20-day Bollinger band is flattening and the price has bounced off the lower band in recent sessions. The relative strength index reads about 46, neutral but tilted toward the lower half, which gives sellers a small edge until momentum shifts.
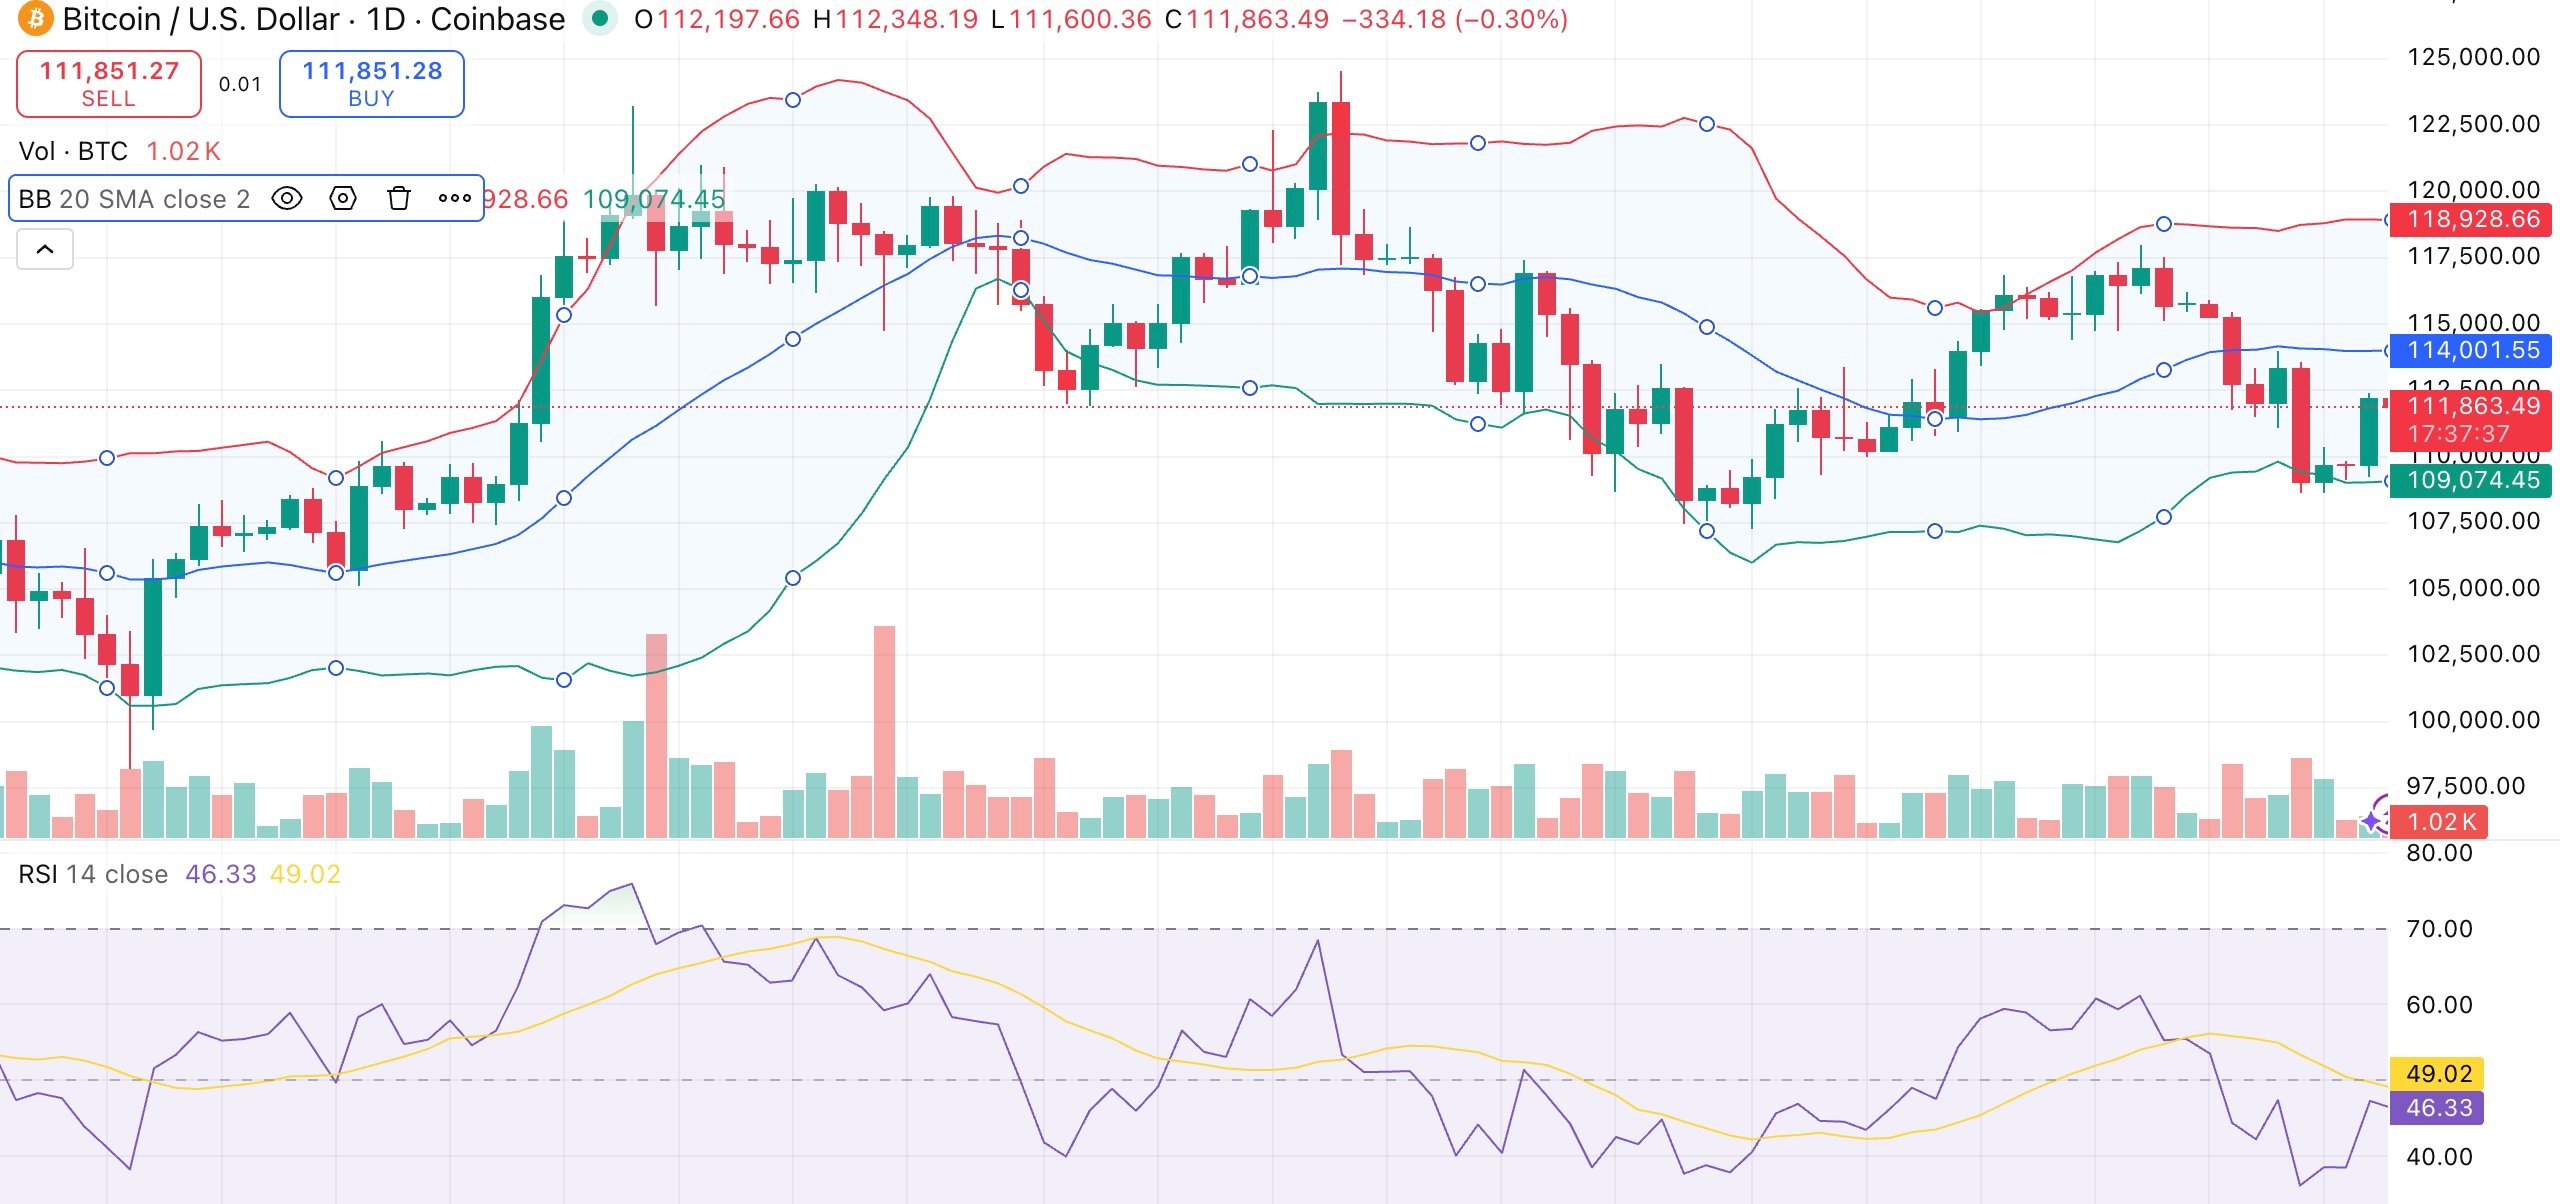
Oscillators are mixed. MACD is slightly negative, momentum shows a recent uptick that favored buyers, and the ADX at ~18 implies the trend is weak. Traders should watch volume on any break. Rising volume would confirm direction, thin volume would increase the chance of a false move.
Key short-term support sits at $109,000–$111,000. A decisive break below that zone would likely push the price toward the 200-day moving average around $106,000 and would invite renewed selling.
On the upside, sellers appear between $115,000 and $118,000. A clean break above $118,000 would open the path back to the $123,000–$124,000 area.