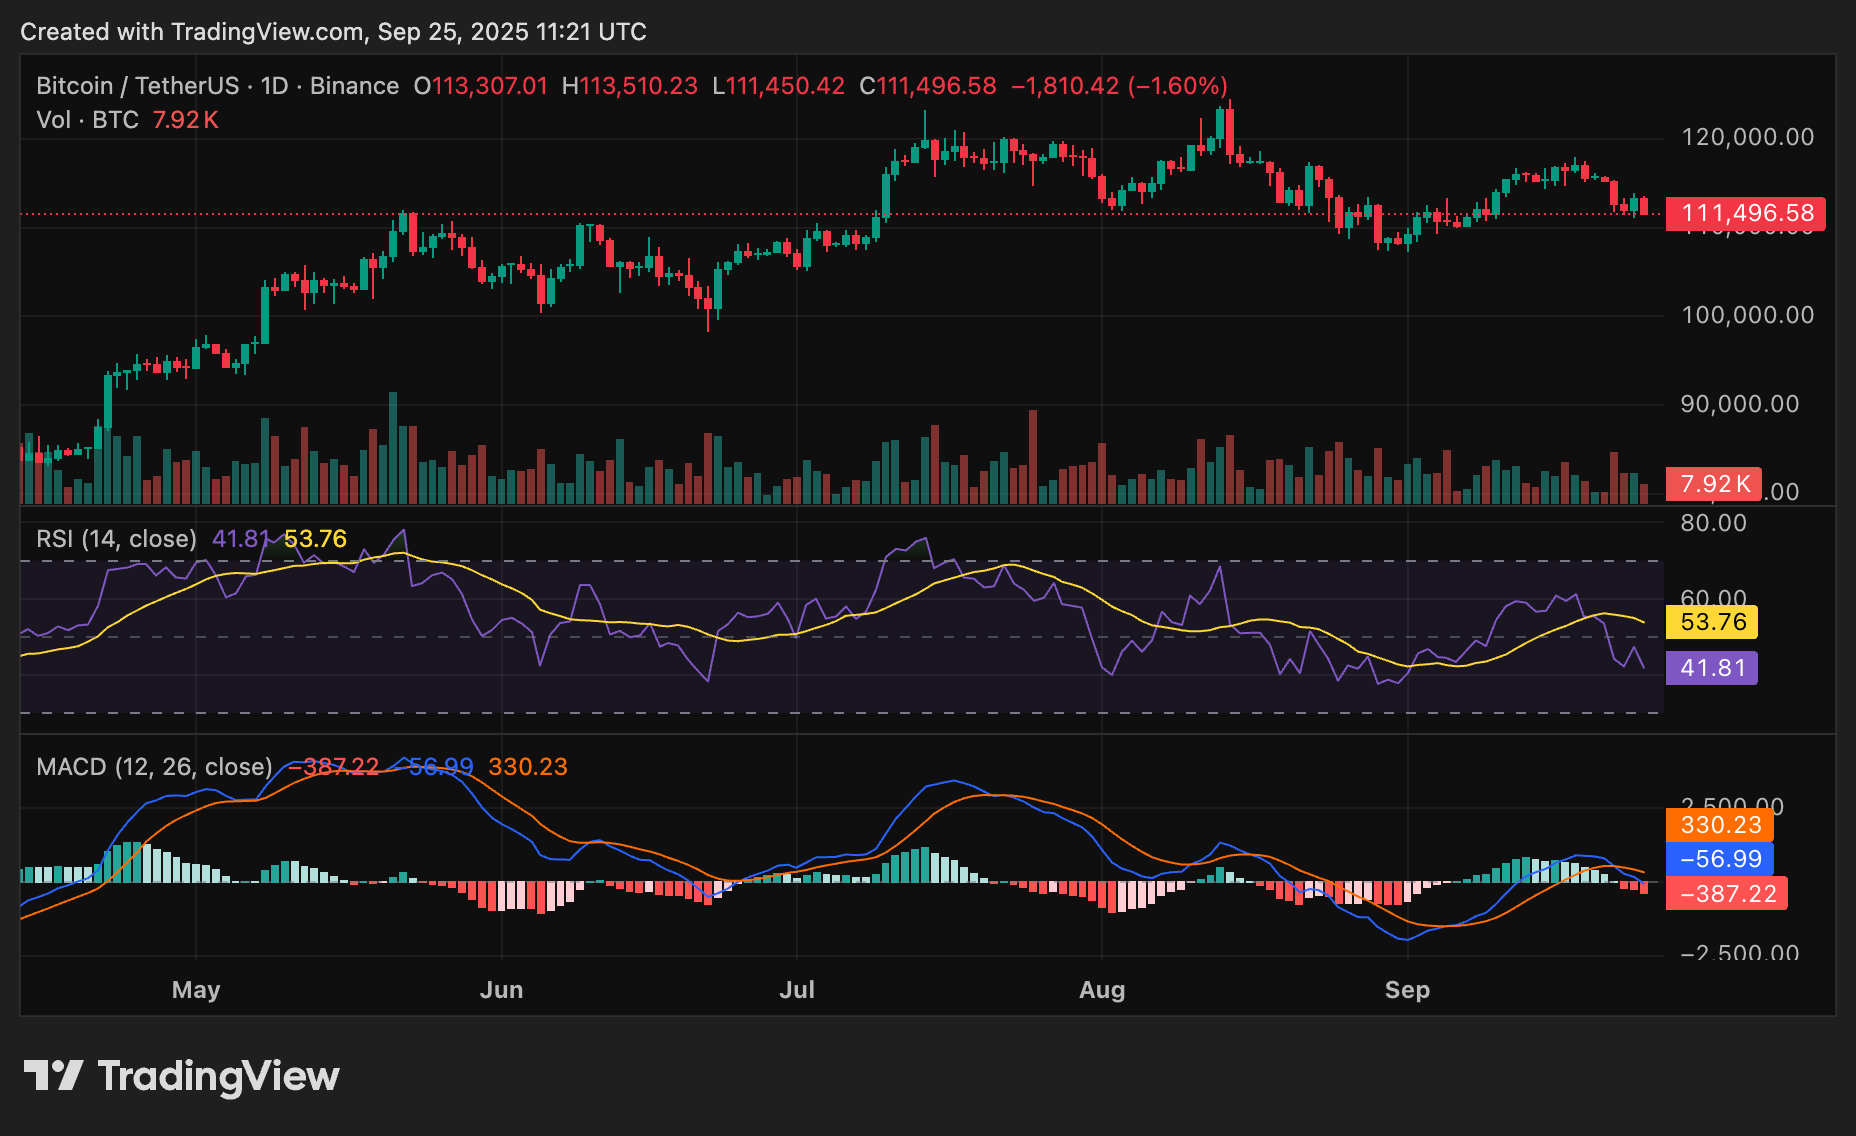
Bitcoin price has dipped again. The decline comes amid growing investor caution ahead of U.S. inflation data, rising ETF outflows, and massive liquidations.
Summary
- Bitcoin price sits at $111,678, down 0.9% on the day.
- The crypto giant’s losses come ahead of U.S. inflation data, creating investor uncertainty.
- Exchange-traded funds tracking Bitcoin recently recorded outflows reaching $466 million.
- If BTC price breaks below $110,000, next support is $108,000.
Bitcoin price has extended its losing streak for the fourth consecutive day, shedding 0.9% in the past 24 hours to trade at $111,678, according to market data crypto.news.
The downturn reflects mounting investor caution as markets brace for key U.S. inflation data, with traders unsure whether the Federal Reserve will lean hawkish or dovish in its next moves. The uncertainty has triggered broad risk-off sentiment, leading many to scale back exposure to Bitcoin (BTC) and other risk assets.
Bitcoin price under pressure amid strong ETF outflows and liquidations
Following the significant $1.7 billion liquidation on Monday, one of the largest of 2025, there has been increased profit-taking among investors who are trying to cut down exposure to Bitcoin. This is further driven by the broader market cooldown, which is making investors more cautious.
Adding to the negative sentiment is a rise in ETF outflows. The U.S.-listed funds tracking BTC posted $466 million in outflows in recent days, outweighing the smaller inflows recorded earlier in the week.
Also, investors are positioning ahead of Friday’s $22.6 billion Bitcoin future options expiry. Historically, Bitcoin tends to experience selling pressure ahead of large expirations, as leveraged positions are unwound and traders hedge risk. A relief rally could follow once the expiry passes and broader uncertainty clears.
Technical indicators show weak momentum
On the technical side, Bitcoin price is now significantly below its September 19 peak near $117,000, forming a descending pattern of lower highs and lower lows, a classic bearish structure. The RSI has dropped to 42.30, signaling waning buying interest, while the MACD has flipped bearish with a growing negative histogram.
Volume remains muted, highlighting indecision from both bulls and bears. If Bitcoin fails to hold above the $110,000 support, a further drop toward $108,000 is likely. However, a recovery above $113,500 could help spark a price rebound.


